
May 4, 2018
2:00 pm EDT
2:00 pm EDT
Click here to register
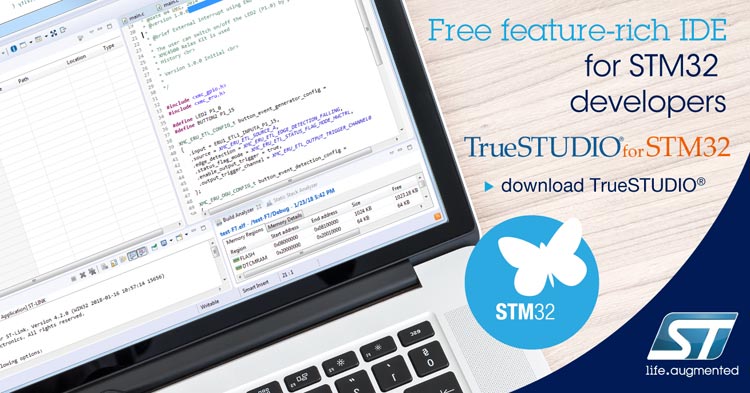
As any builder, handyman, or software developer knows, the right tools make all the difference in meeting deadlines, working efficiently and delivering a quality product. In embedded development the quality of your tools often determines the length and difficulty of the project schedule, particularly when it comes to debugging, test, and software optimization. In this webinar we will show a number of tools in Atollic TrueSTUDIO for STM32 that can be used to debug and profile your code.
Key Take-A-Ways:
- Build analysis, visualize how code and data is placed in the build output memory layout
- Stack analysis, visualize the stack usage of your functions and entire application
- Fault analysis, a simple way of examining CPU fault conditions
- Printf() re-direciton to ITM ports, software tracing with minimal overhead
- Statistical profiling, understand which portions of code consume most CPU time
- Exception/Interrupt tracing, examine exception and interrupt behavior
- Data tracing, non-intrusive monitoritoring of memory accesses
Click here to register


