
Amazon FreeRTOS: Behind the Scenes
I recently wrote an article for embedded.com entitled “A Peek Inside Amazon FreeRTOS” where I started to analyze the high-level behavior that the Amazon FreeRTOS application exhibits while running on an STM32F475 IoT Discovery Node. In this post, I will continue the analysis by demonstrating how a developer can follow the communication flow and examine the code execution without reviewing a single line of code.
It’s often said that a picture is worth a thousand words, and even in embedded software, this is still the truth. I’ve been using Percepio Tracealyzer to understand the Amazon FreeRTOS run-time behavior and one important aspect that we should be interested in as developers is how data and communication flows through-out the application. Using the communication view, Amazon FreeRTOS exhibits the following behavior:
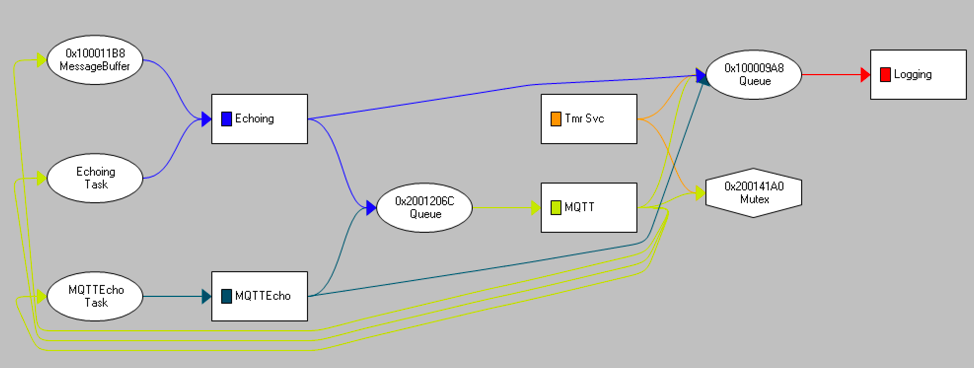
In this single picture, we can easily see how the data flows through the application and what we should be looking for in the source. For example, we can see that there is:
- A single mutex that is shared between the MQTT and TmrSvc tasks
- There are two queues in the application
- There is a single message buffer used to communicate between the MQTT and Echoing tasks
- The TmrSvc, Echoing and MQTTEcho task can send information to the logging task through a queue
- A queue is used to send information to MQTT from Echoing
Since Amazon FreeRTOS doesn’t include any of this information in the documentation, a developer would normally have to recreate this themselves by reviewing the source code. If they didn’t, they may not have the entire picture on how the software behaves and the chances can increase dramatically that bugs will be introduced when the code base is modified.
Seeing the communication flow is one thing, but a developer may want to understand more about what a particular task is doing. In order to better understand the Echoing task, I clicked on the last instantiation and reviewed the events that were generated when it executed. You can see the event data below:

In the event data, a developer should be able to see the events that match the communication flow. Waiting for the message buffer, receiving the buffer, sending data to the MQTT queue and the logging queue and then waiting again on the message buffer. Closer scrutiny does reveal that there are malloc events that are occurring during run-time. If this application has hard real-time requirements, we may want to flag this since malloc is often non-deterministic and could result in other performance issues such as memory fragmentation. Notice also that we are only seeing memory being dynamically allocated and no memory is being released! So, either we have a memory leak in the application or this memory is freed elsewhere in the application.
Tracking down the free statements could require us to dig into the code and match each malloc and free statement. Instead, I noted that this task was executing around 2 minutes and 7 seconds and filtered the event log for instances of free. Clicking on the event, a developer can see that the memory that is allocated in Echoing is used to store information that is also used by the Logging task. Once the Logging task is done with the data, it frees the memory location. The trace information can be seen below:
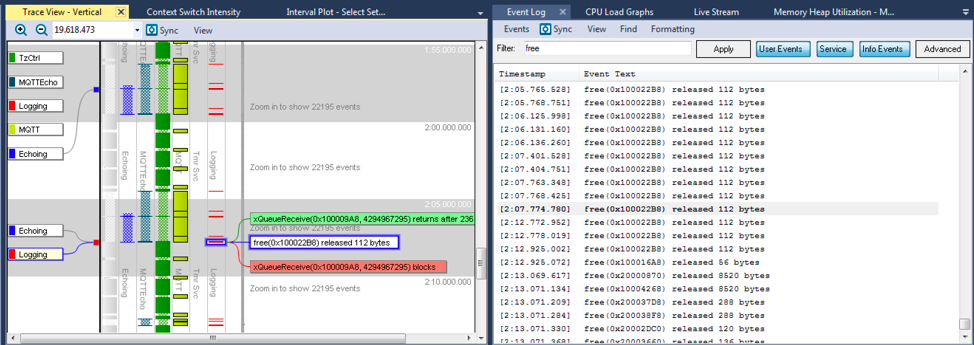
Scrolling through the event log, I estimated that there must be several hundred calls to free throughout the approximate 3-minute execution time. Just out of curiosity I exported the log and discovered that free is called 57,769 times! That’s 321 calls to free per second! (Which raises concerns that the heap could become fragmented). For a production system, we may want to statically allocate a buffer or use a memory pool to limit allocating and freeing memory so much which is undoubtedly eating away at available CPU cycles.
Now there was one last item that I wanted to investigate further before closing out this post. Several weeks ago, I wrote an article for DesignNews entitled “The Unknown and Hidden Behaviors of Real-Time Embedded Systems” where I noticed that a deleted task in FreeRTOS 9.0.0 was never quite deleted. I found this to be curious behavior and wanted to see if Amazon FreeRTOS, which is based on FreeRTOS 10.0.0, exhibited the same behavior. I used the event viewer to find the only two instances of vTaskDelete in the application and reviewed them. The trace can be seen below:
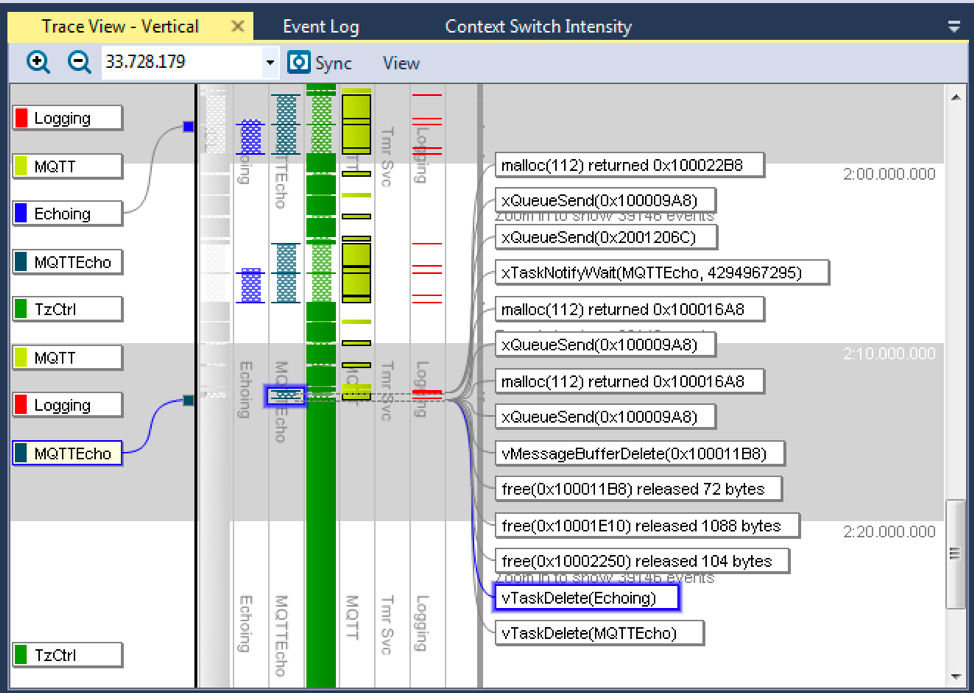
After calling the vTaskDelete function, the Echoing and MQTTEcho task no longer appear in the trace data. This means that the phantom task execution that I saw in FreeRTOS 9.0.0, no longer appears in FreeRTOS 10.0.0, which is quite reassuring.
As we’ve seen through-out this article, using trace technology can be extremely useful to analyze a code base which has no documentation or that we want to better understand from an execution stand-point. We’ve also seen that Amazon FreeRTOS appears to behave in a predictable manner and also exhibits some behaviors that a developer working on a production intent system may want to investigate further.
References
- https://www.embedded.com/electronics-blogs/say-what-/4460619/A-peek-inside-Amazon-FreeRTOS
- https://www.designnews.com/content/unknown-hidden-behaviors-real-time-systems/68115970458405
Struggling to keep your development skills up to date or facing outdated processes that slow down your team, raise costs, and impact product quality?
Here are 4 ways I can help you:
- Embedded Software Academy: Enhance your skills, streamline your processes, and elevate your architecture. Join my academy for on-demand, hands-on workshops and cutting-edge development resources designed to transform your career and keep you ahead of the curve.
- Consulting Services: Get personalized, expert guidance to streamline your development processes, boost efficiency, and achieve your project goals faster. Partner with us to unlock your team's full potential and drive innovation, ensuring your projects success.
- Team Training and Development: Empower your team with the latest best practices in embedded software. Our expert-led training sessions will equip your team with the skills and knowledge to excel, innovate, and drive your projects to success.
- Customized Design Solutions: Get design and development assistance to enhance efficiency, ensure robust testing, and streamline your development pipeline, driving your projects success.
Take action today to upgrade your skills, optimize your team, and achieve success.


I note Amazon FreeRTOS. Has FreeRTOS been bought or is this a variant on the opensource project??
Great question. The FreeRTOS kernel does remain open source but last fall Amazon announced Amazon FreeRTOS which is based on the FreeRTOS kernel. They essentially bought FreeRTOS. The FreeRTOS founder Richard Barry now works for Amazon in the Amazon FreeRTOS product group. Amazon is using Amazon FreeRTOS as a new RTOS which comprises FreeRTOS along with several libraries designed to ease connecting to Amazon Web Services (AWS).
Does it mean that FreeRTOS kernel won’t evolve anymore?
The claim is that it will be business as usual but only time will tell.
This article would have been more useful to those unfamiliar with Tracealyzer if the images used were actually large enough to read! Other than that, thank you for sharing this.
Thanks for the comment. You can always try ctrl and scroll to make the images larger in your browser or download them and open them. The resolution is there but the standard page boundaries limit their width.