
Simplify Debugging using RTOS Aware Debugging
Many embedded applications have reached a complexity level that requires them to use a real-time operating system (RTOS) to manage task timing, memory and many other activities within the application. Using an RTOS can be a welcome component to help simplify development but at the same time, an RTOS can add complexity and the potential for things to go wrong. One method that developers can use to improve their insight into how their RTOS based application is executing is to use RTOS aware debugging.
RTOS aware debugging is essentially a component or a plug-in that is included in a developers’ integrated development environment (IDE) that understands the RTOS being used and provides the developer with useful information about how the RTOS and application are behaving. RTOS aware debugging can often include basic information such as:
- Task or thread information
- RTOS object status
- Memory utilization
- Timer and system statistics
Without RTOS aware debugging, a developer may have to really dig deep in order to find the information that they are looking for.
The information that is available to a developer often varies based on the RTOS that is used along with the IDE. One very common and useful feature is the ability to see thread information. When a developer uses RTOS aware debugging, they can review their threads status information to gauge important details such as:
- Thread priority
- Thread name
- Thread status
- Stack size and maximum usage
- Thead execution count
In a typical application, a developer will often have to manually monitor their thread stacks in order to make sure that they don’t overflow. When they are able to integrate into their RTOS with their IDE, they can visually monitor this information and see what the maximum stack usage was and determine whether they are getting close to an overflow or even whether they have significantly oversized the stack. Below is an example that was pulled from a simple application that was using SEGGER EmbOS.
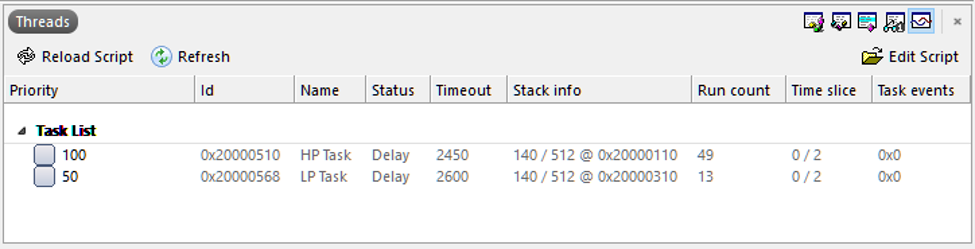
While the information shown might seem basic, it can provide developers with extraordinary insights into how their application is behaving. For example, we can clearly see that only 140 bytes out of 512 was being used by each thread for their stack. If this was a worst-case test for these threads, a developer may decide to trim the stack size to 256 and use the memory elsewhere in the application. We can also see that the high priority task runs 49 times versus the low priority tasks 13 times. A developer can quickly review this numbers and if we were expecting a 2:1 or 3:1 ratio, we could discern that something is not quite right with the application.
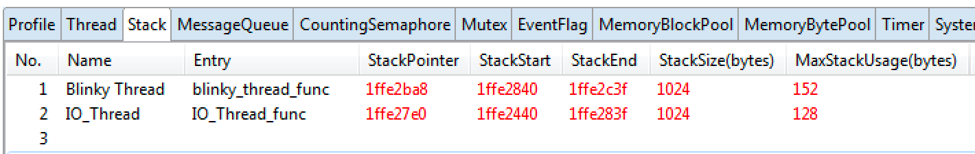
As mentioned earlier, getting information about the tasks is really just the starting point. Some RTOSes and IDE’s allow a developer to view much more information. For example, E2 Studio integrated with the Express Logic ThreadX RTOS can reveal thread information but also allows a developer to examine RTOS objects and states for message queues, counting semaphores, mutexes and event flags. This allows a developer to get more in-depth understanding about how the RTOS is behaving in their application than would have traditionally been available to an embedded developer. A simple example can be seen below which can also be compared to the above example.
Conclusions
As RTOSes are deployed in more and more systems, developers need to come up to speed and start utilizing the new tools that are available to debug these systems. RTOS aware debugging is just one such technique that developers can use to quickly glean insights from their system that would traditionally have required significant effort. Make sure that you include it in your toolbox so that you can decrease how much time you spend debugging.
If you would like to learn more about how to use an RTOS when developing a product, you can check-out Jacob’s RTOS Training courses or contact Jacob to help you develop your RTOS Software Architecture.
Struggling to keep your development skills up to date or facing outdated processes that slow down your team, raise costs, and impact product quality?
Here are 4 ways I can help you:
- Embedded Software Academy: Enhance your skills, streamline your processes, and elevate your architecture. Join my academy for on-demand, hands-on workshops and cutting-edge development resources designed to transform your career and keep you ahead of the curve.
- Consulting Services: Get personalized, expert guidance to streamline your development processes, boost efficiency, and achieve your project goals faster. Partner with us to unlock your team's full potential and drive innovation, ensuring your projects success.
- Team Training and Development: Empower your team with the latest best practices in embedded software. Our expert-led training sessions will equip your team with the skills and knowledge to excel, innovate, and drive your projects to success.
- Customized Design Solutions: Get design and development assistance to enhance efficiency, ensure robust testing, and streamline your development pipeline, driving your projects success.
Take action today to upgrade your skills, optimize your team, and achieve success.