The 2026 RTOS Benchmark Study Is Now Available
Most teams choose their real-time operating system (RTOS) the same way. Someone used FreeRTOS on the last project. It worked; they learned the APIs. So, that becomes the choice. No matter what the application needs to do. Almost nobody benchmarks several RTOSes to see which actually fits their application.
That is understandable. Benchmarking eight kernels fairly takes weeks of configuration, porting work, and calibration. So, teams inherit a decision instead of making one.
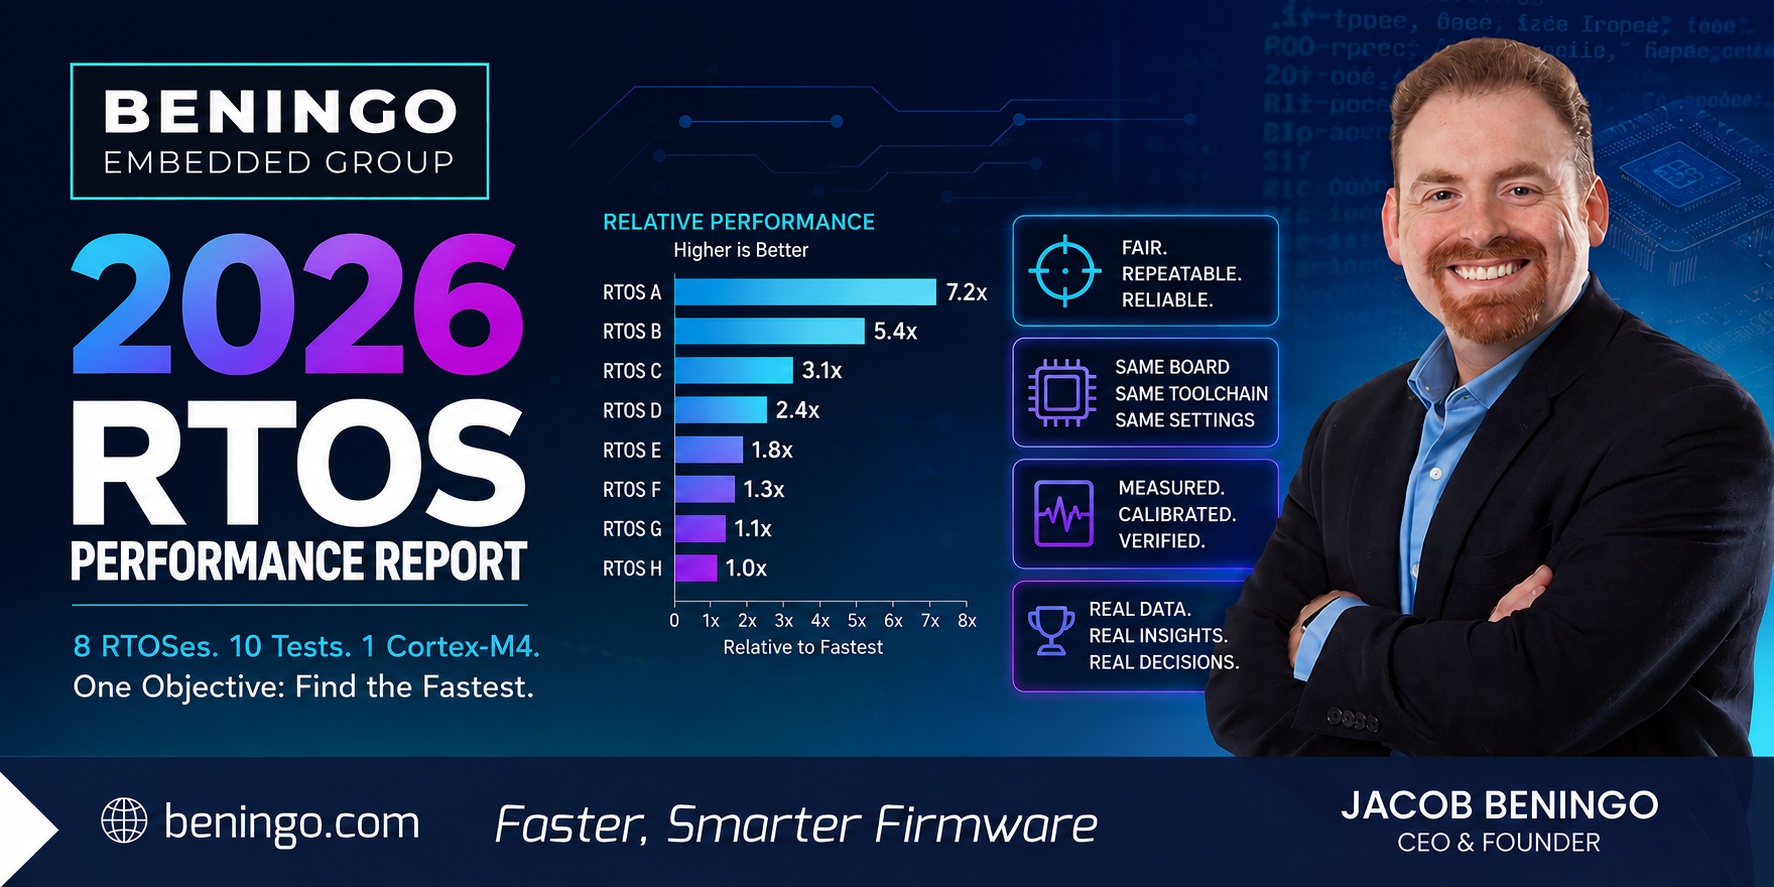
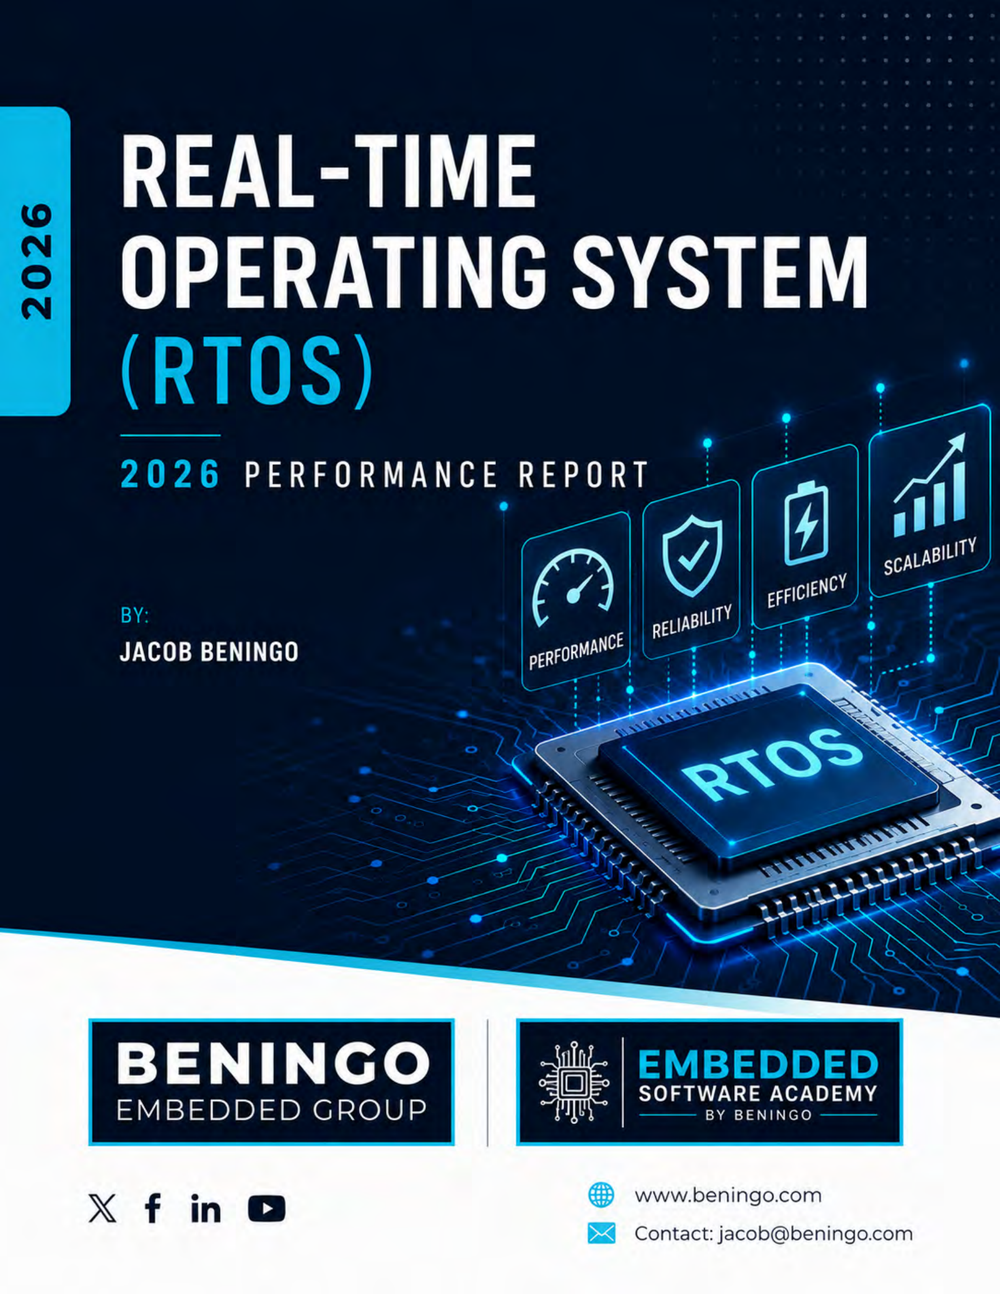
That’s NOT how engineering should be done, and that’s why I decided to help ease the burden by conducting a proper RTOS benchmark study of the most-used kernels in my 2026 RTOS Performance Report.
In this post, I’ll tell you what I measured in the RTOS benchmark study and how I measured it. I’ll tell you a little bit about the results and what it means for the industry. All the per-kernel numbers, rankings, and latency tables can be found in the full report.
What the 2026 RTOS Benchmark Study Measures
The Thread-Metric Suite and the Calibration Test
The RTOS benchmark study is based on the Thread-Metric benchmark suite, originally offered by Microsoft and now maintained under the Eclipse Foundation. The suite is MIT-licensed and available on GitHub. It consists of eight tests: a calibration test plus seven that exercise the RTOS itself.
Each test runs for a fixed 30-second interval and reports a throughput count. A higher number means a more efficient kernel. Every result is captured over two consecutive windows to confirm repeatability, and those windows agree to within 0.1%.
The calibration test matters more than it looks. A single thread increments a counter in a tight loop, with no RTOS services involved. That loop should run at the same speed under every kernel on the same board and compiler. If the spread exceeds about 1%, the comparison is not apples-to-apples, and nothing downstream can be trusted. This test is not about the RTOS at all. It is the control that makes the other seven credible.
Hardware and Toolchain
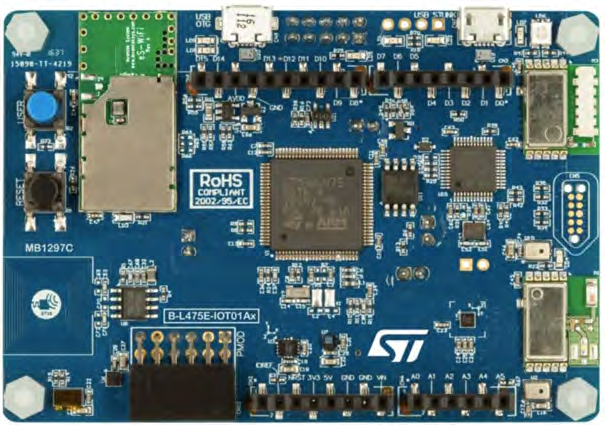
The primary analysis ran on the ST B-L475E-IOT01A Discovery kit, an STM32L475VG microcontroller (MCU) with a Cortex-M4F core at 80 MHz. This is the same board the 2024 study used, so the two editions compare directly. Results held consistent across multiple boards, well within a 1% margin.
Everything else is documented as well: GCC 13.3.rel1, a 1000 Hz system tick, instruction cache on, and the memory protection unit off.
What’s New in the 2026 Edition of the RTOS Benchmark Study
Eight Kernels, Ten Tests
The 2024 study measured four RTOSes across five tests. This edition of the RTOS benchmark study measures eight across ten.
The four newcomers are Arm Keil RTX5, RT-Thread, NuttX, and Micrium uC/OS-III. Alongside FreeRTOS, Eclipse ThreadX, PX5 RTOS, and Zephyr, the cohort now covers the commercial, foundation-backed, and community open-source landscape.
The test count grew for two reasons. First, this edition completes the full eight-test Thread-Metric suite by adding the two interrupt tests that 2024 omitted. Second, it adds a two-part, oscilloscope-measured interrupt-latency study on top of the counting tests.
Four Studies That Did Not Exist in 2024
A POSIX-API study. A dedicated chapter re-runs the entire benchmark through each RTOS’s POSIX API instead of its native one. POSIX is the portable operating system interface standard (pthreads, POSIX semaphores, message queues) that lets code move between kernels and even to Linux. That portability is not free, and the cost is not uniform. Two of the eight kernels offer no POSIX path at all, which is worth knowing before portability becomes a requirement.
A compiler study, IAR versus GCC. An appendix rebuilds the whole benchmark with the IAR Arm compiler, from the same test, kernel, and HAL source the GCC build uses. It compares the two head-to-head across seven RTOSes, all eight tests, and three matched optimization levels, in both speed and code size.
An oscilloscope interrupt-latency study. A hardware timer drives the stimulus and two GPIOs mark the software events, with three taps of a mixed-signal oscilloscope capturing the timing. Because these are wall-clock measurements, they are reported as median, 99th percentile, and maximum.
Cross-architecture data. An appendix extends the study to three Cortex-M33 boards, which separates the effect of the processor architecture from the effect of kernel design.
There is also a year-over-year chapter. Because I replicated the exact 2024 build methodology, I can report how each of the original four kernels changed between editions.
Why the RTOS Benchmark Study Methodology Is the Story
Normalize What the Harness Introduces; Disclose What the Kernel Introduces
Where a setting is a knob, I set it the same way for every kernel: argument checking off, stack checking off, asserts and trace off, time-slicing off, a constant-time scheduler, and BASEPRI-scoped critical sections. Where a difference is architectural, baked into how a kernel is built rather than a switch I can flip, I leave it as the vendor ships it and disclose it. Measuring that difference is the entire point of the RTOS benchmark study.
The memory test shows how the rule works in practice. It runs a fixed-block pool on six kernels and a general heap on two, because that is what those kernels provide. A fixed-block pool is an O(1) pointer-pop, while a general heap walks a free list. These are different operations by design. Forcing a false equivalence would hide a real difference in what the kernels actually offer.
Disclosure Is What Makes the Numbers Usable
The report publishes the configuration table, per-RTOS settings appendices, exact kernel versions, and the full toolchain. You can reproduce the RTOS benchmark study. You can also attack it, and I would rather you could.
One thing is worth stating plainly: this RTOS benchmark study is conducted independently, and it is not affiliated with or endorsed by any RTOS provider.
You can download the 2026 RTOS Performance Report to see the complete configuration and results.
Two RTOS Benchmark Study Findings You Can Use Right Now
Your Application Build Is a Bigger Lever Than Your Kernel
The single largest factor in the absolute numbers is not the RTOS. It is how you compile your application.
Moving the application from -O0 to -O2 lifts kernel-test throughput by roughly 10 to 50%. The bare calibration loop runs about 2.75x faster. Same C code, same silicon, same kernel.
This effect shows up in the calibration data as well. At -O0, the counter loop is memory-bound and swings with build-specific data placement, which pushes the spread to 3.6% and fails the study’s own 1% rule. At -O2 and above, the loop compiles to identical tight code on every kernel and the field closes to 0.9%.
The takeaway is blunt. Check your build settings before blaming your RTOS.
Dispatch Latency, Not IRQ Entry, Is the Real Differentiator
The oscilloscope study captures two separate quantities. IRQ latency is the time from the hardware interrupt request firing to the first instruction of the interrupt handler. Dispatch latency is the time from that handler signaling a higher-priority thread to the thread actually running.
IRQ latency splits along interrupt-entry architecture rather than kernel speed. Most of the cohort clusters tightly, because that number is essentially Cortex-M exception entry at 80 MHz. A few kernels sit higher for structural reasons the report documents.
Dispatch latency is where kernel design shows up. It spans 7.6x at the 99th percentile (p99) across the cohort, meaning the latency met on 99% of interrupts. That is the figure that governs an interrupt-driven design.
Two practical notes come out of this. Rank on the tail rather than the median, because a median is too optimistic for a deadline argument and a single maximum can be one freak sample. Then decorrelate your stimulus from the kernel tick. A stimulus period commensurate with the 1 kHz tick phase-locks every sample, which biases the median and hides the jitter. I used a 271 microsecond period, deliberately coprime with the 1 ms tick, so the phase drifts across the whole tick interval.
What’s in the Report
Per-kernel results, the overall ranking, the per-test winners, and the full latency table with median, p99, and maximum are in the report rather than in this post.
So is a good deal more. The report covers build footprint in flash and static RAM, what the POSIX API costs on each kernel, the complete IAR versus GCC appendix, a study of what enabling MPU stack guards costs on a real design, and configuration appendices for all eight kernels.
One caveat carries over from the report itself. Performance is only one of an RTOS’s important attributes, and rarely the one that decides a project. Memory usage, documentation, toolchain compatibility, middleware, certification, licensing cost, and professional support all belong in the same decision. If you are early in that process, 7 Characteristics to Consider when Selecting an RTOS is a reasonable place to start.
Use the RTOS Benchmark Study Data to Narrow the Field
The 2026 edition grew in scope, but the value still sits in the methodology. A calibration test that has to pass first. A disclosed configuration table. Published settings for every kernel so the results can be reproduced and scrutinized.
Two findings transfer whether or not you ever open the report. Your application build is a first-order performance lever, largely independent of which kernel you chose. And dispatch latency, measured at the tail, is where kernel design genuinely separates the field.
Let the throughput and latency numbers narrow your options. Then weigh the finalists across the full set of attributes and validate them against your own workload.
When you picked the RTOS running on your current product, what evidence was that decision actually based on? And would it survive being re-run today?
Download the full 2026 RTOS Performance Report to see the complete results.
Want embedded engineering insights like this delivered to your inbox? Sign up for my Embedded Bytes newsletter to get the latest posts, insights, and hands-on tips delivered straight to your inbox.
Struggling to keep your development skills up to date or facing outdated processes that slow down your team, raise costs, and impact product quality?
Here are 4 ways I can help you:
- Embedded Software Academy: Enhance your skills, streamline your processes, and elevate your architecture. Join my academy for on-demand, hands-on workshops and cutting-edge development resources designed to transform your career and keep you ahead of the curve.
- Consulting Services: Get personalized, expert guidance to streamline your development processes, boost efficiency, and achieve your project goals faster. Partner with us to unlock your team's full potential and drive innovation, ensuring your projects success.
- Team Training and Development: Empower your team with the latest best practices in embedded software. Our expert-led training sessions will equip your team with the skills and knowledge to excel, innovate, and drive your projects to success.
- Customized Design Solutions: Get design and development assistance to enhance efficiency, ensure robust testing, and streamline your development pipeline, driving your projects success.
Take action today to upgrade your skills, optimize your team, and achieve success.