
5 Embedded System Tools to Decrease Costs and Time to Market
Embedded systems are complex devices and getting them to work the way that they are supposed to can be a challenge. The average developer on average spends around 40% of their time debugging their software. This can lead increased costs and time-to-market as developers grapple with system complexities and try to understand how various software components are interacting in their system. There are several tools that I use in my own development cycle that I have found to be indispensable in helping not just understand the software but also to help decrease my costs and time to market. Let’s examine several of these tools.
Tool #1 – A trace enabled debugger
The first tool that I find is critical to have in the toolbox is a trace enabled debugger. Whether it’s an ARM Keil ULINKplus or a SEGGER J-Trace, these tools provide a developer with the ability to access streaming trace capabilities and the memory on an embedded target. These high-end debuggers can be interfaced to several different visualization tools that can provide developers with insights into how their system is behaving. While the high-end tools may not always be necessary to use these visualization tools, I’ve found that their secondary features such as unlimited break-points, spare GPIO pins and even energy monitoring can be indispensable.
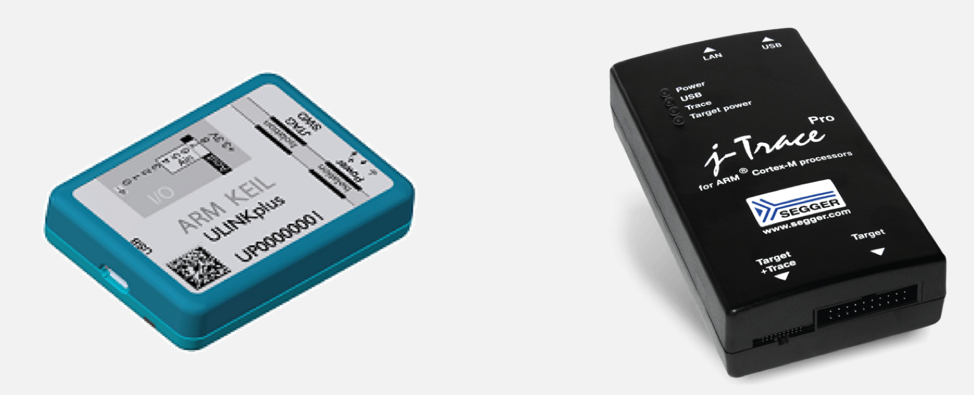
(Image Sources: ARM Keil and SEGGER)
Tool #2 – Micrium uC Probe
Micrium’s uC Probe can be used for real-time visualization of variables and data in an embedded application. Developers are able to custom build their own user interface that best suits their needs to monitor how their system is performing. I’m a newer user to Micrium uC Probe because I originally thought that it could only be used with the various versions of uC OS. I recently learned at Embedded World that uC Probe can be used on nearly any embedded system where the debugger is capable of simultaneously accessing the microcontrollers memory. This capability gives the tool the ability to read memory in a non-intrusive manner that contains nearly no overhead if a developer is using a J-Link or a j-Trace.
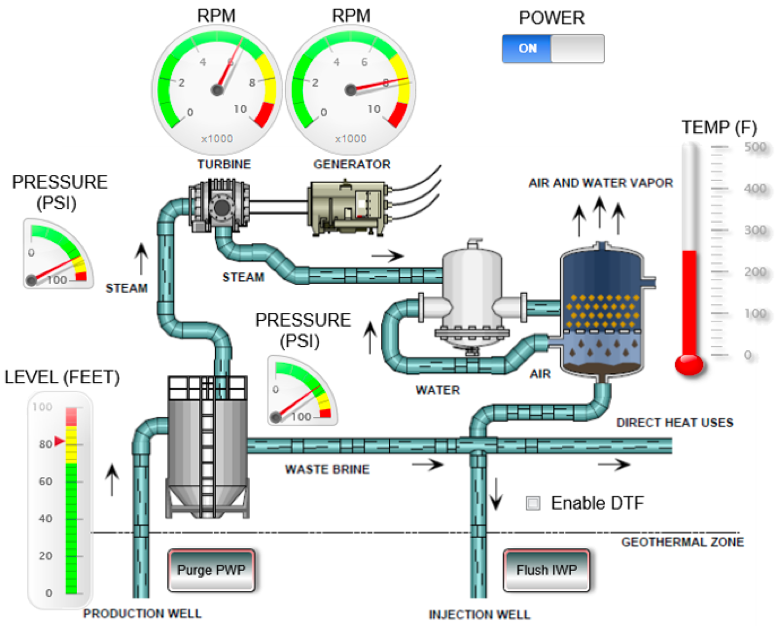
(Image Source: Micrium)
Tool #3 – Percepio Tracealyzer
Over the past several years I’ve grown quite fond of using Percepio Tracealyzer to trace an embedded application and visualize how it is behaving. Tracealyzer can be integrated into an RTOS based application to record the events that are happening in the application such as task context switches, interrupts, mutex locks and unlocks along with many other events that occur. These events can be recorded in a single shot manner around a particular problem area in code or can be real-time streamed and viewed to a host computer. Once the trace has been recorded, a developer can then use more than 30 views to review the program execution, task and event timing, communication flow and many other aspects of the application. I will typically use this tool to debug an application but I will also use it to trace example code, software stacks and other code that I want to understand.
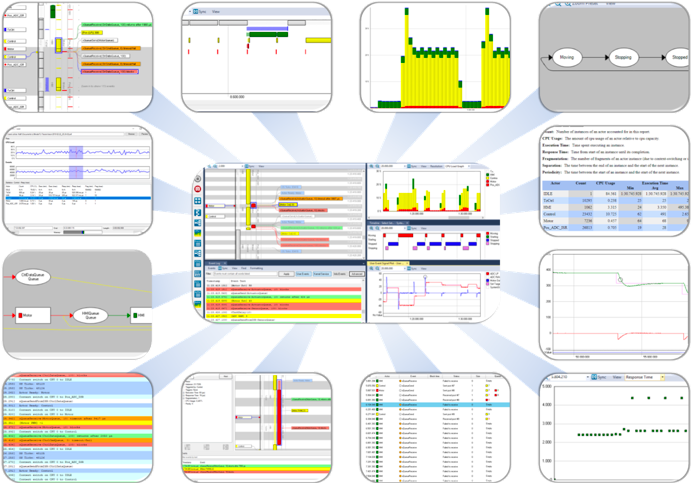
(Image Source: Percepio)
Tool #4 – SEGGER System View
SEGGER System View is another trace visualization tool that can be used to see what an application is doing. System View records RTOS events and displays a few useful pieces of information such as the task timing, task execution visualization and the CPU load. The tool contains just four views but it’s enough to still get useful information about how the application is behaving which is great for a free tool.
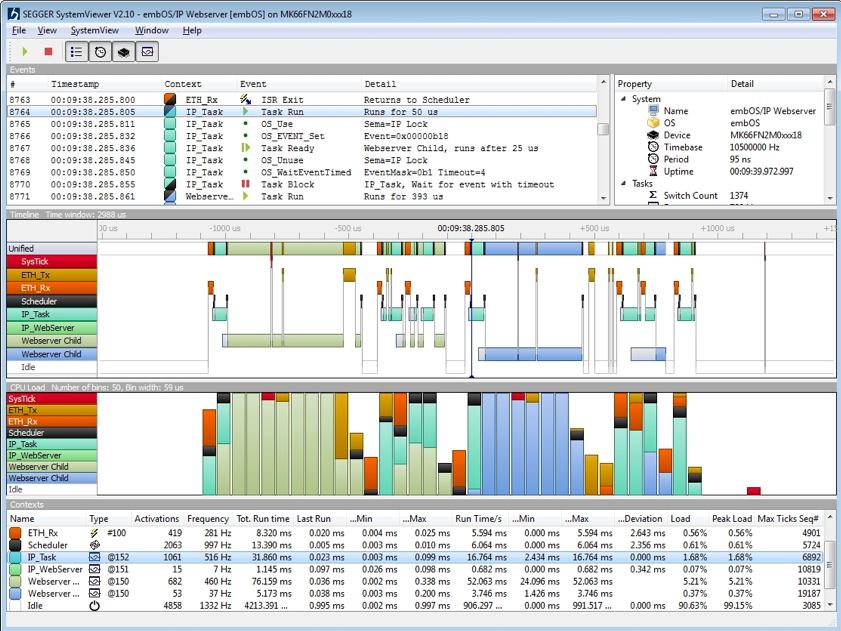
(Image Source: SEGGER)
Tool #5 – SEGGER Ozone
Instruction tracing can be an important tool to embedded software developers who are interested in ensuring that their test cases get 100% coverage over their code base. A free tool that developers can use in conjunction with the J-Trace is SEGGERs Ozone. Ozone allows a developer to not just see how good their code coverage is but allows them to monitor function execution and see every instruction that has been executed in the code. There are many details that a developer can glean from their application using this tool.
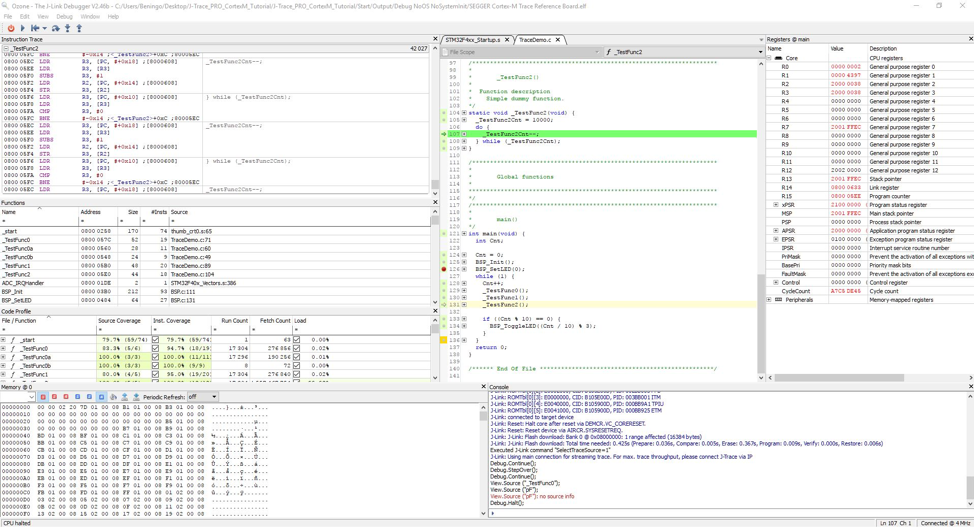
(Image Source: SEGGER)
Conclusions
Early in my career, I was always uneasy that I couldn’t see what was actually happening as my system executed its software. Sure, I could look at external behaviors and add a few instrumentation messages to verify the behavior to some extent, but I could never see everything. If you can’t see what the system is doing, it makes it difficult to debug and to verify the software. If you can see what’s happening, developers can come to solutions far faster which at the end of the day saves time and money. These applications are examples of tools that I use. There certainly could be others for different tool chains. I hope that you will investigate what tools fit within your own environment that provide these types of capabilities.
Struggling to keep your development skills up to date or facing outdated processes that slow down your team, raise costs, and impact product quality?
Here are 4 ways I can help you:
- Embedded Software Academy: Enhance your skills, streamline your processes, and elevate your architecture. Join my academy for on-demand, hands-on workshops and cutting-edge development resources designed to transform your career and keep you ahead of the curve.
- Consulting Services: Get personalized, expert guidance to streamline your development processes, boost efficiency, and achieve your project goals faster. Partner with us to unlock your team's full potential and drive innovation, ensuring your projects success.
- Team Training and Development: Empower your team with the latest best practices in embedded software. Our expert-led training sessions will equip your team with the skills and knowledge to excel, innovate, and drive your projects to success.
- Customized Design Solutions: Get design and development assistance to enhance efficiency, ensure robust testing, and streamline your development pipeline, driving your projects success.
Take action today to upgrade your skills, optimize your team, and achieve success.

THANKS Jacob, For the nice list. I have also used Jtrace.
How about Trace 32 and STlink?
They didn’t show up in your top 5, any reason for that?
Vikas
Thanks for the comment. I have not used Trace32 so I cannot comment on it. It may be a good one for developers to try. As far as STlink goes, it’s an okay low cost debugger but I’ve found it to be buggy, slow and not very capable when compared to third party tools like a SEGGER tool. I actually replace my ST-Link devices with the SEGGER J-Link firmware.
I know I’m commenting on an article that is 5 years old, but… you said SEGGER SystemView “is great for a free tool.” I looked up SystemView, and it looks like it costs $1880. Is that something that has changed in the last 5 years, or am I not looking at the right product?
Thanks for the comment. Things certainly do change in 5 years.
Looking at their website, it looks like the tool is still free but only for non-commercial application. aka, for course work or if you want to test it out. You are correct in that the price does seem to start at $1880. I’m not sure when this changed, but once upon a time the tool was completely free unless you want to record very large amounts of data.