Tools – Real-time Application Visualization Using Tracealyzer 4.2
It has often been said that a picture is worth a thousand words. When it comes to debugging embedded software, a picture is worth a hundred thousand lines of code. For most of my career, I’ve always felt apprehensive about running code on a target and verifying a few external features to say that the system is working. What if the system is running off into the weeds but it just looks like everything is ok? If I can’t see the execution path that the software is taking I can’t be 100% sure what the software is doing. It’s nothing more than a black box. A few years ago, I discovered Percepios’ Tracealyzer tool and it completely revolutionized the way that I develop embedded software.
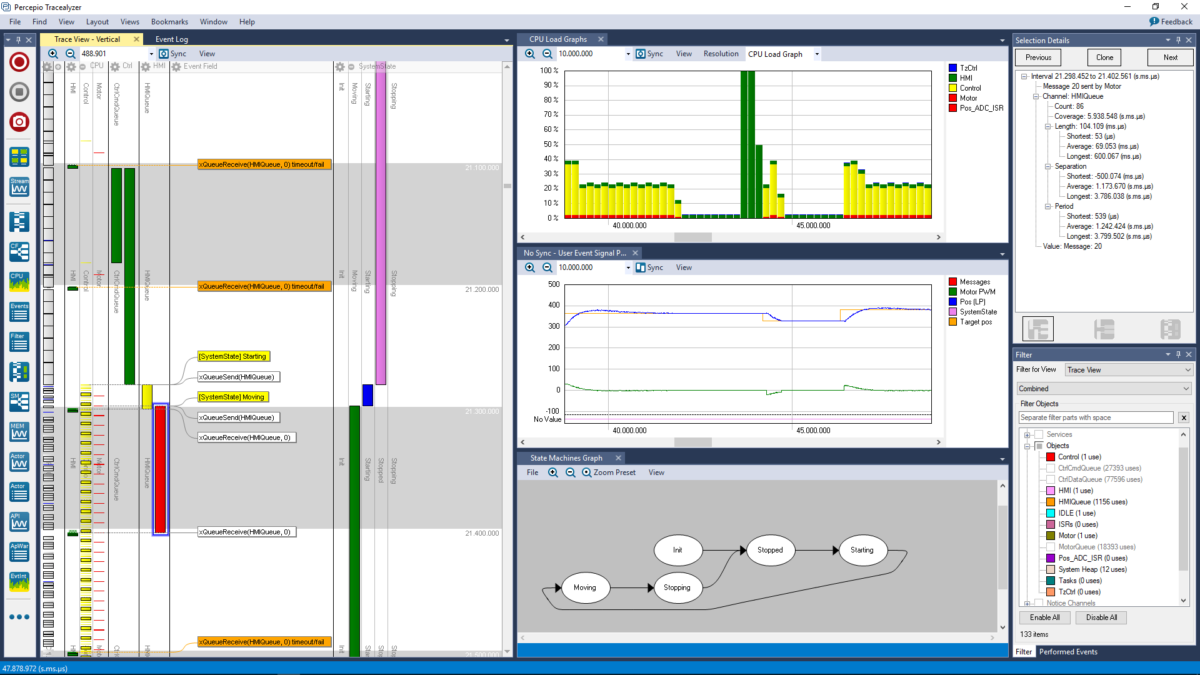
It’s important to note that Tracealyzer is a visualization tool that can be used with real-time operating systems. As different events occur within the application, they are recorded using a lightweight recorder library that runs on the embedded target and stores the event data in RAM. An example of events that can occur include:
- Task context switches
- Interrupts
- Memory allocations
- Messages being sent/received
- Sempahore puts/gets
- Etc
When the RTOS is in an idle state, the event RAM buffer can be read out through a debugger such as a SEGGER J-Link or through the ITM included on an Arm® Cortex®-M processor. The recorder library not only tracks the event but also important information such as event timing. This allows the PC based application to reconstruct the events that occurred while the system was executing including the context information. So, a developer can look through their trace and see how it was executing, when interrupts occurred and so forth.
Over the last several years, I’ve found that there are quite a few benefits to using Tracealyzer. These benefits have included:
- Better insight into the application run-time
- Decreased time spent debugging (which directly affects time-to-market and costs)
- The ability to trace an open source or 3rd party library and understand how it affects the systems behavior
- Decreased stress (this can be as important as many of direct project benefits)
Recent updates to Tracealyzer in version 4.2 have even pushed the usefulness of the tool even further. In versions prior to version 4.0, developers could only take a snap-shot of their applications execution. In 4.x and later, developers can view the application trace in real-time and record a nearly limitless amount of trace data to analyze. Several new features in 4.2 include:
- I/O monitoring
- State machine visualization
- A revamped trace view
For this post, I’m just talking about Tracealyzer from a very high-level point of view. I recently used Tracealyzer in a series of articles for embedded.com on how a peek in Amazon FreeRTOS. To see a little bit more on how Tracealyzer can be used and the insights that it can provide, you might be interested in reading the following articles:
- A Peek Inside Amazon FreeRTOS
- A Peek Inside Amazon FreeRTOS: Communication and Memory
- A Peek Inside Amazon FreeRTOS: Publishing Messages to the Cloud
- A Peek Inside Amazon FreeRTOS: Receiving Messages from the Cloud
Struggling to keep your development skills up to date or facing outdated processes that slow down your team, raise costs, and impact product quality?
Here are 4 ways I can help you:
- Embedded Software Academy: Enhance your skills, streamline your processes, and elevate your architecture. Join my academy for on-demand, hands-on workshops and cutting-edge development resources designed to transform your career and keep you ahead of the curve.
- Consulting Services: Get personalized, expert guidance to streamline your development processes, boost efficiency, and achieve your project goals faster. Partner with us to unlock your team's full potential and drive innovation, ensuring your projects success.
- Team Training and Development: Empower your team with the latest best practices in embedded software. Our expert-led training sessions will equip your team with the skills and knowledge to excel, innovate, and drive your projects to success.
- Customized Design Solutions: Get design and development assistance to enhance efficiency, ensure robust testing, and streamline your development pipeline, driving your projects success.
Take action today to upgrade your skills, optimize your team, and achieve success.