
Tools – SciTools Understand
Software analysis tools are an important utility for embedded software developers to have available to them. An analysis tool can show developers where their code is too complex, how their code flows, their component dependencies, and much more. I’m often asked what analysis tools I use and how I generate several of the pretty pictures that I often use in blogs and customer reports. While I use many such tools, in today’s post, we will explore one that I am very fond of; SciTools Understand.
Note: Beningo Embedded Group has no relationship with SciTools other than being a customer.
What is Understand?
Understand is a static code analysis tool that allows you to edit and refactor code, view dependency graphs, see useful metrics, and verify your software architecture. Understand “ships” as an IDE with various toolbars that allow developers to browse metrics, source code, architectures, graphs, and many other elements required to analyze a code base. Beyond the IDE, Understand also comes with a Python API that can be used to automate analysis and, generate custom reports, graphics, and tease out analysis details that might not be fully supported through the IDE. Additional features can be found here.
Code Metric Analysis
Metric analysis and tracking is an important tool every developer should use while developing their code. Metrics can tell you important details about your code, such as:
- The risk associated with changing a function
- Lines of code created
- Cyclomatic complexity
- Coupling
- Cohesion
- Comment ratio
- etc
There are a lot of metric tools available to developers, like Metrix++. However, an important feature to look at in an analysis tool is the ability to visualize the metrics.
Metric Heat Maps
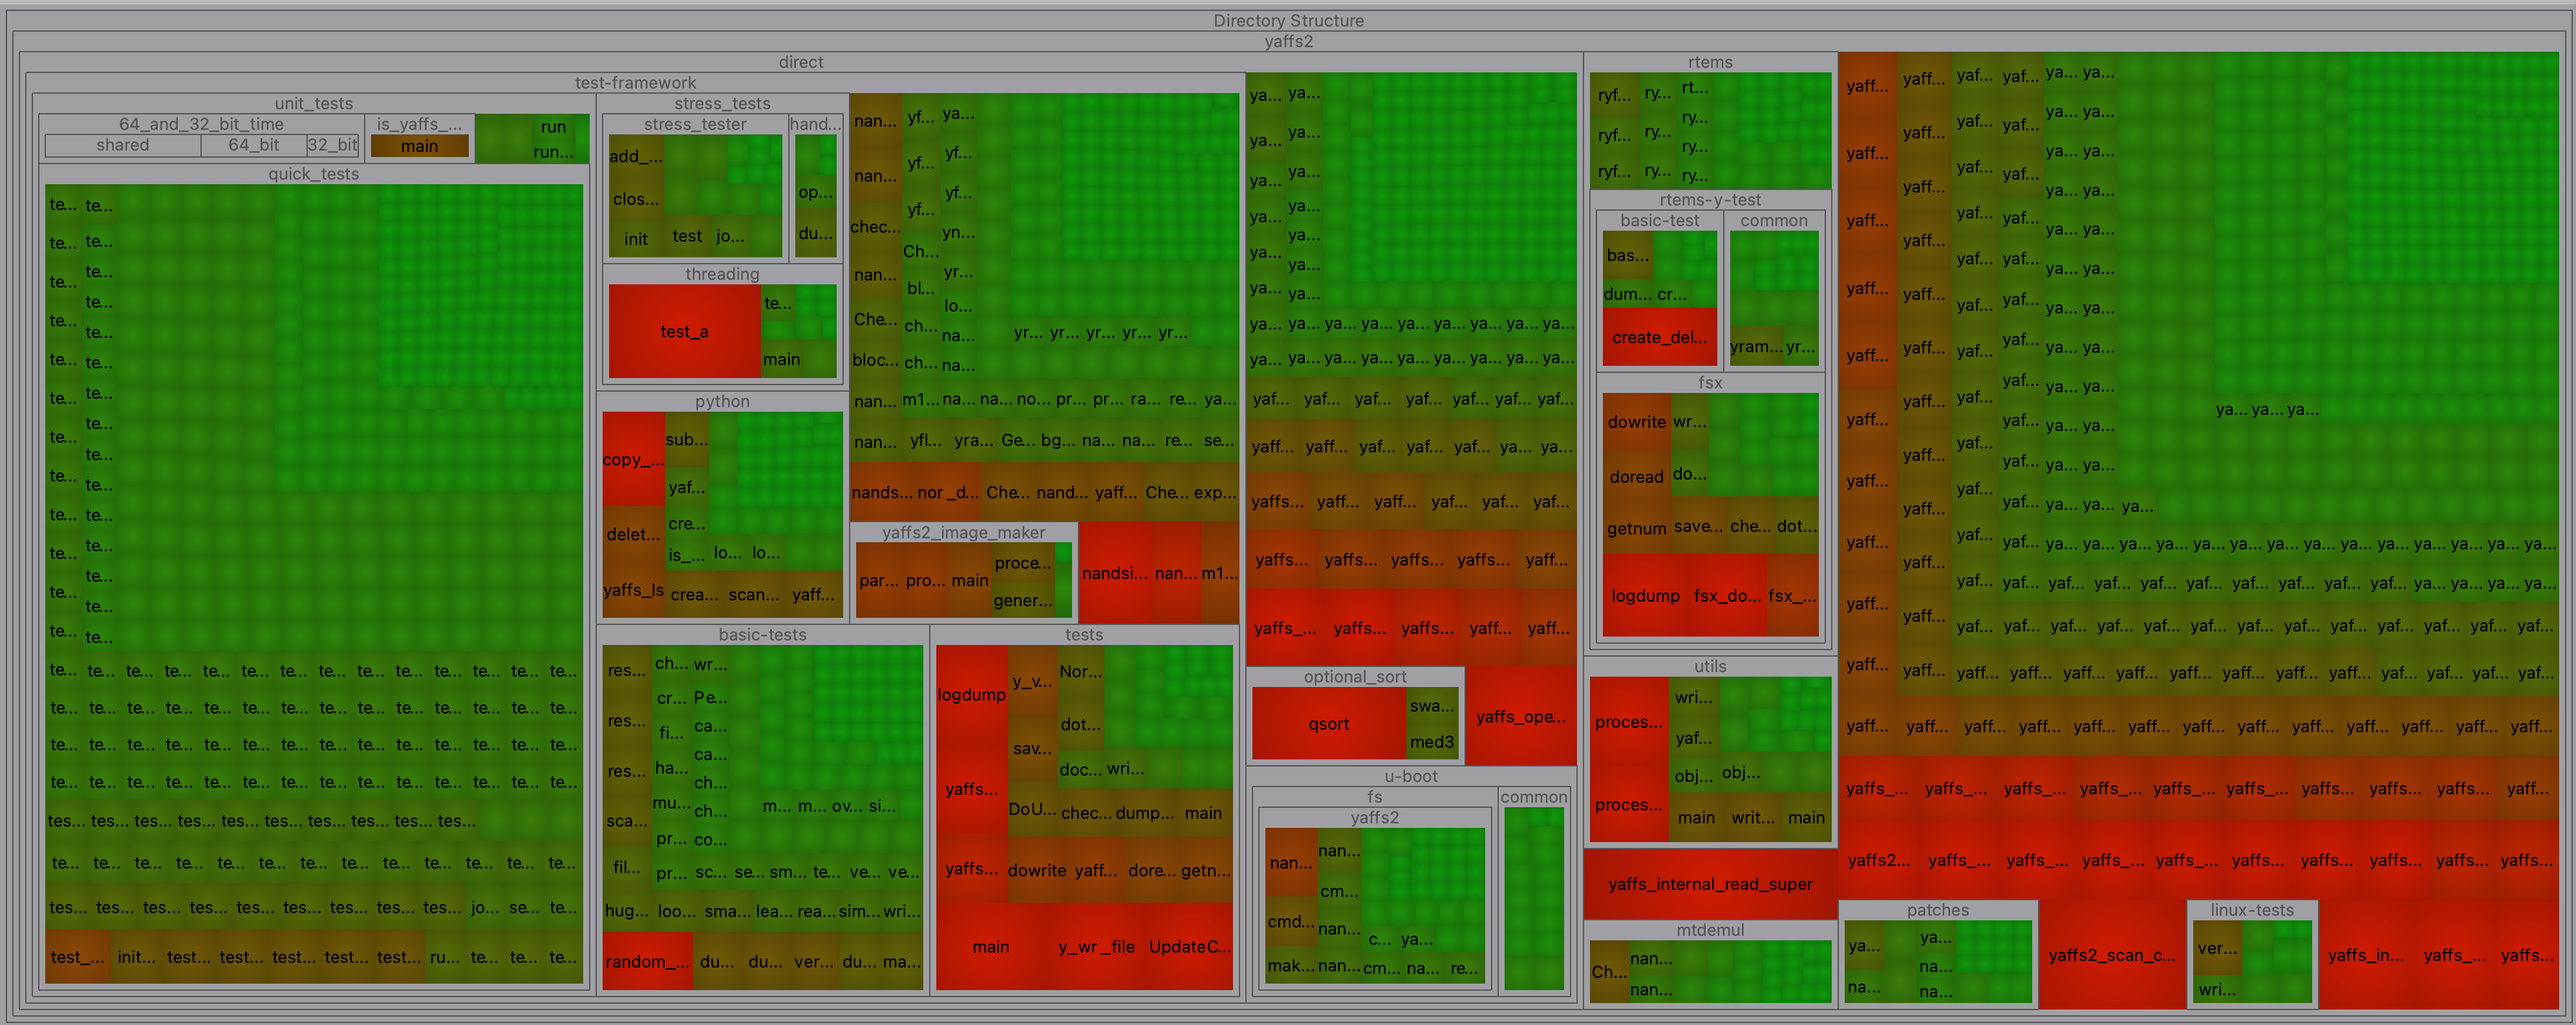
Understand has a really cool heat map feature that I use a lot to get a high-level view of what is going on with the code. For example, if I want to understand a project’s Cyclomatic Complexity, I can create a heat map showing every function in the code. The color of the function will be dependent on the ranges I set. For example, I recently analyzed yaffs, a robust flash file system that has been used on several NASA space missions. Setting a Cyclomatic Complexity range of 0 – 10 generated the following heat map:

The heat map visually points out what functions I might want to look closely at and shows the project’s organization. For example, I can see that nearly half the code is actually a test framework used to validate the software.
I can use Understand to generate a heat map for nearly any metric supported by the tool.
Note: They call heat maps “Treemaps”.
C/C++ Analysis
The analysis tools within Understand go far beyond basic metrics. Developers can also perform static code analysis on their software. For example, developers will find that the following standards analysis is available:

As you can see, several coding standards are available. Developers can even write their own code checks to verify their standards using Python or Perl as described in “Writing Codecheck Scripts in Perl and Python“.
Dependency Analysis
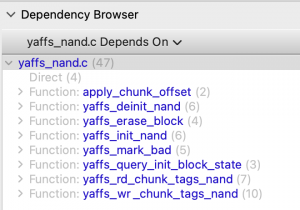
Unfortunately, I often encounter tightly coupled code where dependencies are not managed very well. Another thing I love about Understand is that it has graphing and analysis capabilities to quickly perform dependency analysis on code. For example, if I want to understand what functions yaffs_nand.c depends on, a quick query gets the following results:
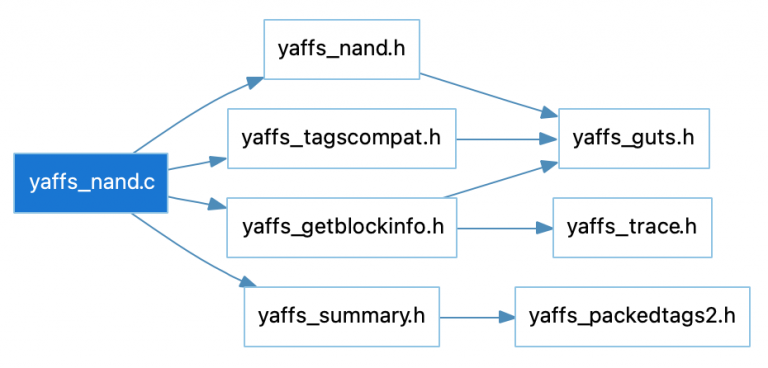
If I want to check the header file dependencies, I get the following:
Below is a dependency graph of one of the main functions in the test suite:
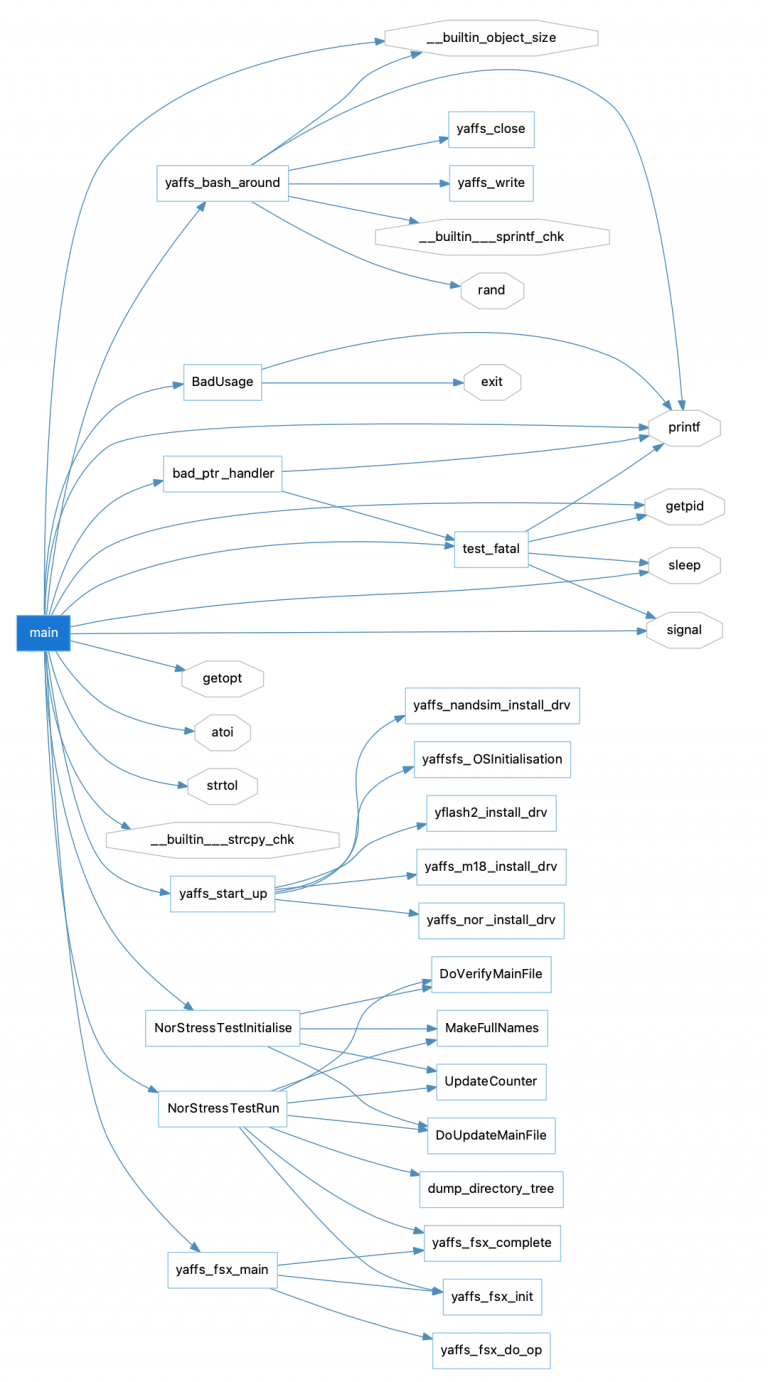
I love this because it often just takes a few seconds to generate these graphs when it would have taken me maybe hours if I had to do it manually. I can quickly navigate the architecture and understand what the code is doing and how it is organized. I can also spot potential issues, and areas that need refactoring or are at high risk for existing bugs or bug injection.
Understand Conclusions
Overall, I’ve found Understand to be useful for my embedded toolbox for the last five years or so. The tool is very versatile and can easily integrate into a build environment or DevOps systems without too much trouble. The tool is commercial, but I’ve found that it provides quite a bit of value for the type of work that I do. I suspect many developers, managers, and embedded software teams will also find it helpful.
Struggling to keep your development skills up to date or facing outdated processes that slow down your team, raise costs, and impact product quality?
Here are 4 ways I can help you:
- Embedded Software Academy: Enhance your skills, streamline your processes, and elevate your architecture. Join my academy for on-demand, hands-on workshops and cutting-edge development resources designed to transform your career and keep you ahead of the curve.
- Consulting Services: Get personalized, expert guidance to streamline your development processes, boost efficiency, and achieve your project goals faster. Partner with us to unlock your team's full potential and drive innovation, ensuring your projects success.
- Team Training and Development: Empower your team with the latest best practices in embedded software. Our expert-led training sessions will equip your team with the skills and knowledge to excel, innovate, and drive your projects to success.
- Customized Design Solutions: Get design and development assistance to enhance efficiency, ensure robust testing, and streamline your development pipeline, driving your projects success.
Take action today to upgrade your skills, optimize your team, and achieve success.