
RTEdbg: Open-Source Data Logging and Tracing for Embedded Systems
Every embedded engineer has a printf story. You add a quick debug statement, rebuild, flash, and suddenly the timing bug you were chasing disappears. Remove the printf, and the bug returns. It is the observer effect in action, and it has been costing firmware teams time and sanity for decades.
The truth is, most teams still rely on printf-based embedded data logging for runtime observability. It works for quick checks. But it does not scale. Printf consumes CPU cycles, flash space, RAM, and stack. It blocks execution. And once you have more than a few hundred lines of output, good luck finding anything useful.
On the other end of the spectrum, commercial tracing tools like Tracealyzer and SystemView offer powerful visualization and RTOS (Real-Time Operating System) analysis. They are excellent products. But they carry per-seat license costs that many teams, particularly those working on open-source or budget-constrained projects, simply cannot justify. (Even though they should!)
That gap between printf and commercial tooling has been a dead zone for years. RTEdbg is an open-source toolkit designed to fill it. It provides minimally intrusive binary data logging for any 32-bit microcontroller (MCU), with host-side decoding, flexible data export, and growing RTOS trace support.
In today’s post, we’ll take an honest look at what RTEdbg does, where it fits, and whether it belongs in your debugging workflow.
Why Printf Debugging Fails at Scale
Printf is not inherently bad. For a quick sanity check during bring-up, it is perfectly fine. The problem starts when printf becomes the only observability tool on the team. And that is exactly what happens on most embedded projects.
Here is why it breaks down. Printf requires string formatting on-target. Every format string lives in flash. Every call consumes stack space, blocks on UART or SWO transmission, and burns CPU cycles that your application needs for real work. On a Cortex-M4 running at 168 MHz, a single printf call can take thousands of cycles. In an ISR or a time-critical control loop, that overhead changes the behavior you are trying to observe.
This is the observer effect applied to real-time systems. The act of logging changes what you are measuring. If your motor control loop runs at 10 kHz and a printf call takes 50 microseconds, you have just consumed half your cycle budget on instrumentation alone.
Then there is the output problem. Printf produces unstructured text. Searching through thousands of lines of serial output for a timing anomaly is not debugging. It is archaeology. There is no structured filtering, no timeline view, and no way to correlate events across tasks or interrupts without building custom post-processing scripts.
None of this means you should never use printf. It means you should not let it be your ceiling.
What Is RTEdbg?
RTEdbg is an open-source toolkit for real-time firmware data logging and tracing. The core idea is straightforward: move the expensive work off the embedded target and onto the host.
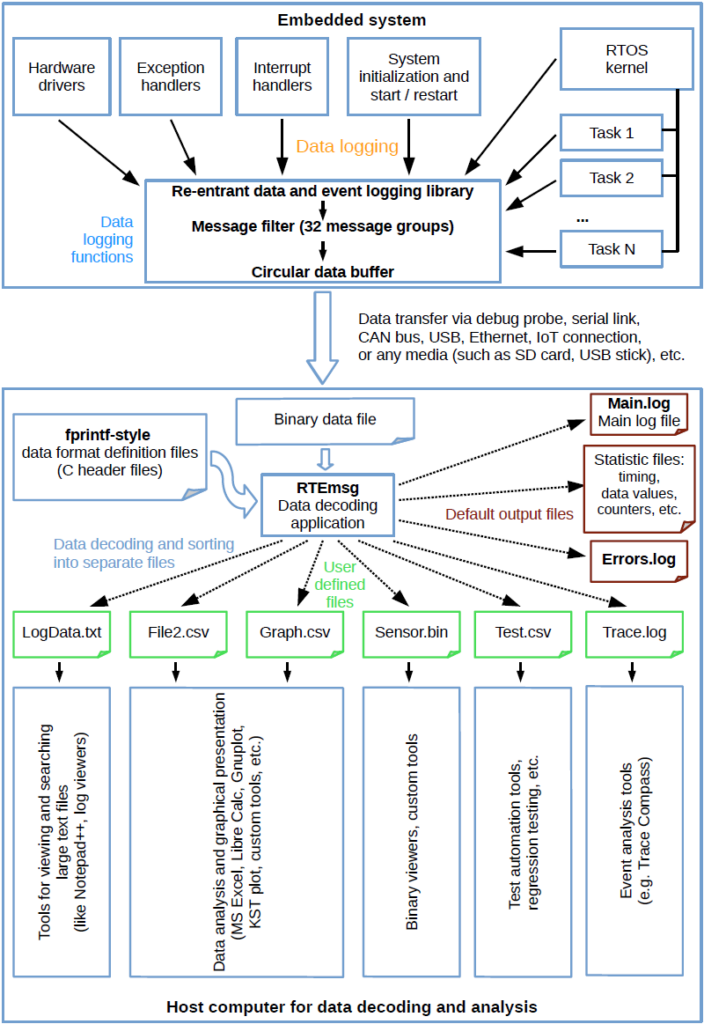
In a traditional printf workflow, the MCU formats strings, encodes data, and transmits human-readable text. RTEdbg flips this model entirely. On the target, lightweight logging macros write raw binary data into a circular buffer in RAM. No string formatting. No encoding. No tagging. Just raw 32-bit words with a format code and a timestamp.
The data is transferred to the host via a debug probe (using GDB), a serial port, or any other available communication channel. On the host, the RTEmsg utility decodes the binary data using printf-style format strings that never left the host in the first place. Think of it as a reentrant, timestamped fprintf() that runs on the host instead of the embedded system.
The performance difference is dramatic. A simple event log on a Cortex-M4 takes roughly 35 CPU cycles and 4 bytes of stack with RTEdbg. Compare that to the hundreds or thousands of cycles and 100-plus bytes of stack a typical printf call requires. The library footprint is a few hundred bytes of code. Format strings consume zero flash on the target.
RTEdbg supports all 32-bit processor families, including ARM Cortex-M, RISC-V, and others. The library is designed for both large RTOS-based systems and small, resource-constrained bare-metal applications.
How It Works: Target to Host
The architecture behind RTEdbg is simple enough to explain in a paragraph, which is part of what makes it work so well.
You instrument your code with lightweight logging macros, RTE_MSG0 through RTE_MSG8, depending on how many values you need to capture. Each call writes raw binary data into a circular buffer in RAM.
No dynamic allocation. No encoding overhead.
Just deterministic writes that play nicely with ISRs, tasks, exception handlers, and even RTOS kernel code because the functions are fully reentrant.
Getting the data off the target is equally straightforward. RTEdbg includes the RTEgetData utility, which pulls the buffer contents to the host via GDB or a serial port. But here is the key insight: the buffer is just a block of memory. Any debug probe or communication channel that can read RAM can transfer it. That portability is a deliberate design choice, not an afterthought.
Once the data reaches the host, the RTEmsg utility does the heavy lifting. It decodes the binary stream using printf-style format strings and routes the output wherever you need it such as log files, CSV for spreadsheet analysis, or VCD files for waveform visualization. Different data categories can be filtered into separate files automatically, so errors, timing data, and application events do not end up in one massive dump.
Inline Logging Functions for Time-Critical Code
For code paths where even function call overhead matters, RTEdbg provides inline versions of its logging functions. These trade a small increase in flash usage for faster execution by eliminating the call and return overhead.
The practical approach is selective. In a motor control ISR that logs PWM duty cycle and current measurements at 10 kHz, the inline version keeps timing impact below the measurement threshold. For application-level logging outside critical paths, the regular function versions keep flash usage minimal.
This kind of selective instrumentation matches the mindset embedded teams need. The goal is not to instrument everything with the fastest possible path. It is to match the instrumentation strategy to the timing constraints of each code section.
Key Capabilities That Set RTEdbg Apart
When I first started to investigate RTEdbg, there were a couple of key features that stood out to me that I think are critical for embedded systems:
- VCD Export for Embedded Data Logging Visualation
- FreeRTOS Trace Support
- Core Dump Logging for Fault Analysis
- Flexible Export and Automation
VCD Export for Embedded Data Logging Visualization
One of RTEdbg’s most practical features is its ability to export logged data to VCD (Value Change Dump) format. VCD is a standard waveform format used by electronic design automation tools, and it can be viewed with free, open-source tools like GTKWave.
Why does this matter for embedded data logging? Waveform viewers give engineers a timing-oriented perspective they already understand from hardware debugging. Instead of scrolling through text logs, you see a timeline of task states, signal values, and application events displayed as waveforms. RTEdbg handles the VCD syntax generation automatically. Developers use familiar printf-style formatting to prepare the data. No proprietary viewer is required.
For anyone who has used a logic analyzer or oscilloscope to debug hardware timing, this visualization approach feels natural. It bridges the gap between how hardware engineers and firmware engineers observe system behavior.
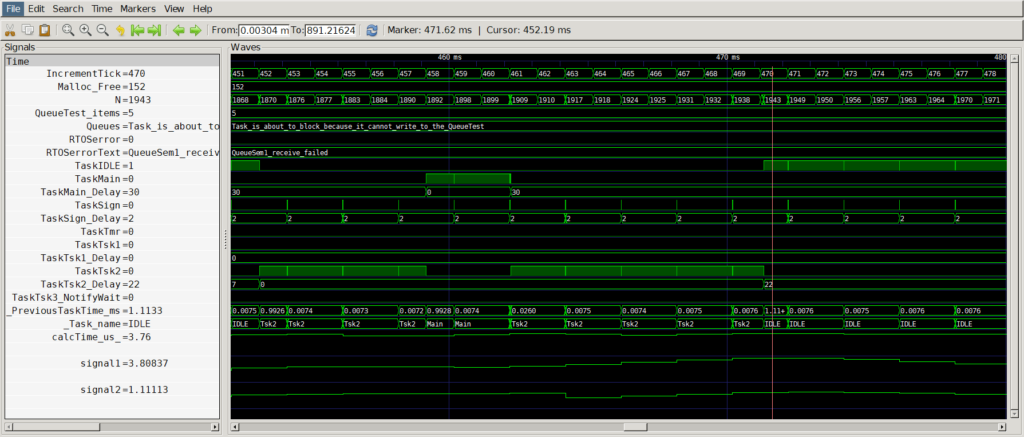
FreeRTOS Trace Support
RTEdbg also integrates with FreeRTOS kernel trace hook macros to capture task switches, queue operations, semaphore events, and error conditions. The trace data is exported to separate log files and VCD files for graphical analysis.
A complete demo project is available in the RTEdbg FreeRTOS trace demo repository. The demo intentionally triggers FreeRTOS errors, such as sending to a full queue and taking an unavailable semaphore, to show the specific information that gets logged when things go wrong. This is exactly the kind of visibility that matters during integration testing.
I want to be honest about the current state. RTEdbg does not yet offer the mature event analysis tools that Tracealyzer or SystemView provide. There is no built-in priority inversion detection or real-time streaming view. RTEdbg provides a tracing foundation with flexible export, not a full analytics platform.
For teams that need deep RTOS analysis with turnkey visualization, commercial tools still have the edge. But for teams that need open-source RTOS visibility at zero licensing cost, RTEdbg is a credible starting point.
Note: You might even be able to use AI tools to help you develop the tools you need for turnkey visualization.
Core Dump Logging for Fault Analysis
This is where RTEdbg earns serious respect from anyone who has debugged field failures. The toolkit includes demo projects for Cortex-M0+, M4, and M7 fault handlers that log CPU registers and stack contents using the RTEdbg library.
The numbers are remarkable. Only 32 bytes of additional code and 20 bytes of stack space are required for a Cortex-M4/M7 core dump. The data is preserved in the circular buffer across watchdog resets. No debug probe needs to be connected at the time of the crash. A service technician or developer can connect later to retrieve the logged data while the system continues to operate normally.
Consider a field failure on a deployed Cortex-M4 device. The system hits a HardFault, but there is no debug probe connected. Because RTEdbg instrumentation is baked into the firmware, the fault registers and the preceding event history are captured in the circular buffer. When someone connects to the device after the fact, the full context is available for host-side decoding. Post-mortem debugging without a connected probe is possible when instrumentation is built into the firmware from the start.
Flexible Data Export and Automation
RTEdbg’s fprintf-based architecture means data can be exported to virtually any text-based format: log files, CSV, VCD, or any custom format that fprintf can produce. Different categories of logged data, such as errors, timing measurements, and application events, can be automatically filtered and sorted into separate output files.

This enables automated test report generation. Instead of manually parsing logs after a test run, the decode step produces structured output files that feed directly into test documentation or CI/CD pipelines. The enhanced macros RTE_MSG5 through RTE_MSG8 support logging up to eight values simultaneously, reducing the number of logging calls needed for complex data points.
Where RTEdbg Fits — and Where It Does Not
RTEdbg fills the gap between printf and commercial tools like Tracealyzer and SystemView. It is strongest for teams that need fast binary logging, open-source licensing, cross-platform 32-bit support, and flexible data export.
Every tool has boundaries, however. RTEdbg does not include a built-in graphical event analysis tool. It relies on external VCD viewers like GTKWave and standard CSV tools for visualization. RTOS trace support is newer and, while the FreeRTOS demo exists and works, integration depth is less mature than commercial alternatives that have had years of refinement.
There is no direct equivalent of Tracealyzer’s priority inversion detection or SystemView’s real-time streaming view. If those capabilities are critical to your workflow, commercial tools remain the right choice for those specific projects.
The honest framing is not that commercial tools are overpriced. It is that the embedded ecosystem benefits when open-source alternatives lower the barrier to proper instrumentation. A team running Tracealyzer on their flagship product might still benefit from RTEdbg on a budget-constrained side project, an open-source contribution, or a quick prototype where setting up commercial licensing would take longer than the debugging itself.
What Open-Source Tracing Means for Firmware Quality
Here is the uncomfortable truth about embedded debugging. The biggest risk is not choosing the wrong tool. It is choosing no tool at all.
When tracing tools are free and lightweight, more teams will actually use them. RTEdbg’s minimal footprint and zero licensing cost remove the two most common excuses for flying blind: “it is too expensive” and “it is too intrusive.” When those barriers disappear, code instrumentation becomes a default practice rather than a special-occasion activity.
This connects directly to how modern firmware teams should work. Faster debugging means binary logging with minimal overhead, so tracing does not slow down development or runtime. Smarter analysis means structured data export and VCD visualization replace guesswork with evidence. Accessible tooling means every team, regardless of budget, can build observability into their firmware from day one.
RTEdbg is not perfect. The RTOS analysis depth and built-in visualization are still maturing. But the foundation is solid, portable, and free under the MIT license. For a project maintained by embedded engineers who clearly understand the constraints of real-time systems, that is a strong starting point.
The Case for Instrumenting Everything
Embedded debugging is evolving. The gap between printf and commercial tools no longer needs to be a dead zone. RTEdbg proves that minimally intrusive, open-source data logging is viable for real projects on real hardware.
If you are evaluating your debugging workflow, start with three practical steps. Evaluate RTEdbg for projects where commercial tool licensing does not fit. Consider it alongside, not necessarily instead of, your existing commercial tools. And treat code instrumentation as a standard practice in every project, not a last resort when something breaks in the field.
The tools exist. The barrier is gone. The only question left is whether your team will use them.
Resources
RTEdbg GitHub Repository: https://github.com/RTEdbg/RTEdbg
Data Export and Visualization Examples: https://github.com/RTEdbg/RTEdbg/blob/master/Views.md
FreeRTOS Trace Demo: https://github.com/RTEdbg/FreeRTOS-trace-demo
GTKWave (VCD Viewer): https://gtkwave.github.io/gtkwave/
RTEdbg Presentation (PDF): https://github.com/RTEdbg/RTEdbg/releases/download/Documentation/RTEdbg.Presentation.pdf
Struggling to keep your development skills up to date or facing outdated processes that slow down your team, raise costs, and impact product quality?
Here are 4 ways I can help you:
- Embedded Software Academy: Enhance your skills, streamline your processes, and elevate your architecture. Join my academy for on-demand, hands-on workshops and cutting-edge development resources designed to transform your career and keep you ahead of the curve.
- Consulting Services: Get personalized, expert guidance to streamline your development processes, boost efficiency, and achieve your project goals faster. Partner with us to unlock your team's full potential and drive innovation, ensuring your projects success.
- Team Training and Development: Empower your team with the latest best practices in embedded software. Our expert-led training sessions will equip your team with the skills and knowledge to excel, innovate, and drive your projects to success.
- Customized Design Solutions: Get design and development assistance to enhance efficiency, ensure robust testing, and streamline your development pipeline, driving your projects success.
Take action today to upgrade your skills, optimize your team, and achieve success.