Revolutionizing Embedded Debugging: IAR C-SPY in VS Code
Do you know how much time embedded developers spend debugging?
From my experience helping embedded teams and companies, the number is usually 20-40%.
In more complex or poorly disciplined projects, it can reach 80%!
In other words, if a project takes one year to complete, 2.4-4.8 months are spent performing failure work. (Fixing what wasn’t done right the first time.)
And interestingly, a portion of that time isn’t even spent solving the actual bugs. It’s wasted setting up the debugging workflow or trying to mentally visualize what’s happening inside the system.
There’s also another hidden cost: context switching.
Developers constantly jump between windows, IDEs, and toolchains just to confirm one piece of data.
Each switch breaks focus and adds overhead that compounds over time.
It’s a hidden bottleneck that most embedded developers don’t even realize exists.
Over the years, I’ve worked with many debugging tools, and they aren’t all created equal.
In this post, we will explore IAR’s C-SPY Debugger for VS Code helps remove that bottleneck.
It does that by integrating powerful, real-time visualization and analysis tools directly inside the editor many developers already use.
At the heart of it lies Listwindows, a feature that turns debugging into a coherent, synchronized experience.
The Debugging Bottleneck No One Talks About
Every embedded engineer already knows how much time debugging quietly consumes. But few realize the reason why it takes so long.
If we dig deeper into the root cause, it’s usually not just about fixing the bug itself.
It’s actually about navigating a maze of fragmented data:
registers in one window,
variable watches in another,
memory maps buried three clicks deep,
and trace data tucked behind yet another tab.
Every context switch drains focus, and every manual correlation between those views introduces delay and risk.
In many teams I’ve worked with, debugging accounts for 20–40% of total project time. In some other systems, it can spike to 80%.
To add insult to injury, a large portion of that 80% debugging time is lost not to coding but to rebuilding the mental model of how the bug behaves repeatedly between sessions.
I don’t know about you, but many embedded teams are literally assigning debugging workflow setup as a JIRA/sprint task.
It shows just how time-consuming the debugging workflow already is.
You might think this is just part of embedded development. You thought that the complexity was unavoidable.
But it shouldn’t happen that way.
Now imagine if all those disconnected insights (registers, trace, memory, performance) existed in one synchronized, living view. It would all be set up and done in some simple steps.
No tab-switching. No mental gymnastics. Just instant visibility into how your system behaves in real time.
That’s exactly the shift IAR introduces with Listwindows, the core feature of the C-SPY Debugger for VS Code extension. It transforms debugging from a fragmented chore into a single, coherent experience, the one where understanding comes naturally instead of through repetition.
The Evolution of Debugging in VS Code
For years, Visual Studio Code has been the developer’s universal workspace.
It’s light, fast, and endlessly customizable.
But if you’re an embedded developer, you’ve always known there’s been one missing piece: real, hardware-level debugging.
While most industries moved their workflows into VS Code, embedded teams were stuck living a split life.
You wrote firmware in one editor, built it with another toolchain, then switched to a proprietary IDE for debugging. It worked, but it broke the flow.
Yes, there are some third-party VS Code extensions. But they’re not as polished.
That’s the tension most teams quietly accepted; it’s either you want the comfort or the capability.
VS Code offered productivity and familiarity.
Dedicated IDEs offered precision and hardware insight.
Rarely could you have both in one place.
That’s the gap C-SPY Debug extension for VS Code closes.
Engineers no longer need to choose between a flexible editor and a professional debugger.
It brings all the capabilities of IAR’s professional toolchain (breakpoints, memory inspection, trace, profiling, coverage) into the same workspace where developers already spend their day.

The IAR C-SPY Debug Extension for VS Code
The result isn’t just convenience.
It’s continuity.
Developers can stay focused, iterate faster, and see the complete picture of their system without jumping between tools.
With Listwindows, C-SPY’s most powerful visualization feature, workflow becomes even more fluid.
Because for the first time, you can see everything your firmware is doing, in real time, inside the editor you already love.
Listwindows: A Live Spreadsheet for Your Firmware
If the C-SPY Debugger is the engine, then Listwindows is the cockpit.
It’s where data becomes insight and debugging turns from a sequence of commands into a live, visual conversation with your firmware.
Imagine your entire system laid out like a spreadsheet:
every register, memory region, and variable updating in real time as your target runs.
Scroll through the data, and you’re watching behavior, not just reading numbers.
That’s what Listwindows brings to VS Code: the ability to observe your system as a living, moving process instead of static snapshots scattered across tools.
Below are the six key Listwindow views that redefine what it means to “see” your embedded system.
1. Registers View — Real-Time State Awareness
Registers are the heart of every embedded system, but catching their changes in motion has always been difficult.
The Registers View lets you track them live—no halts, no refresh commands. Each value shifts as your system executes, revealing bit-level activity that would otherwise pass unseen.
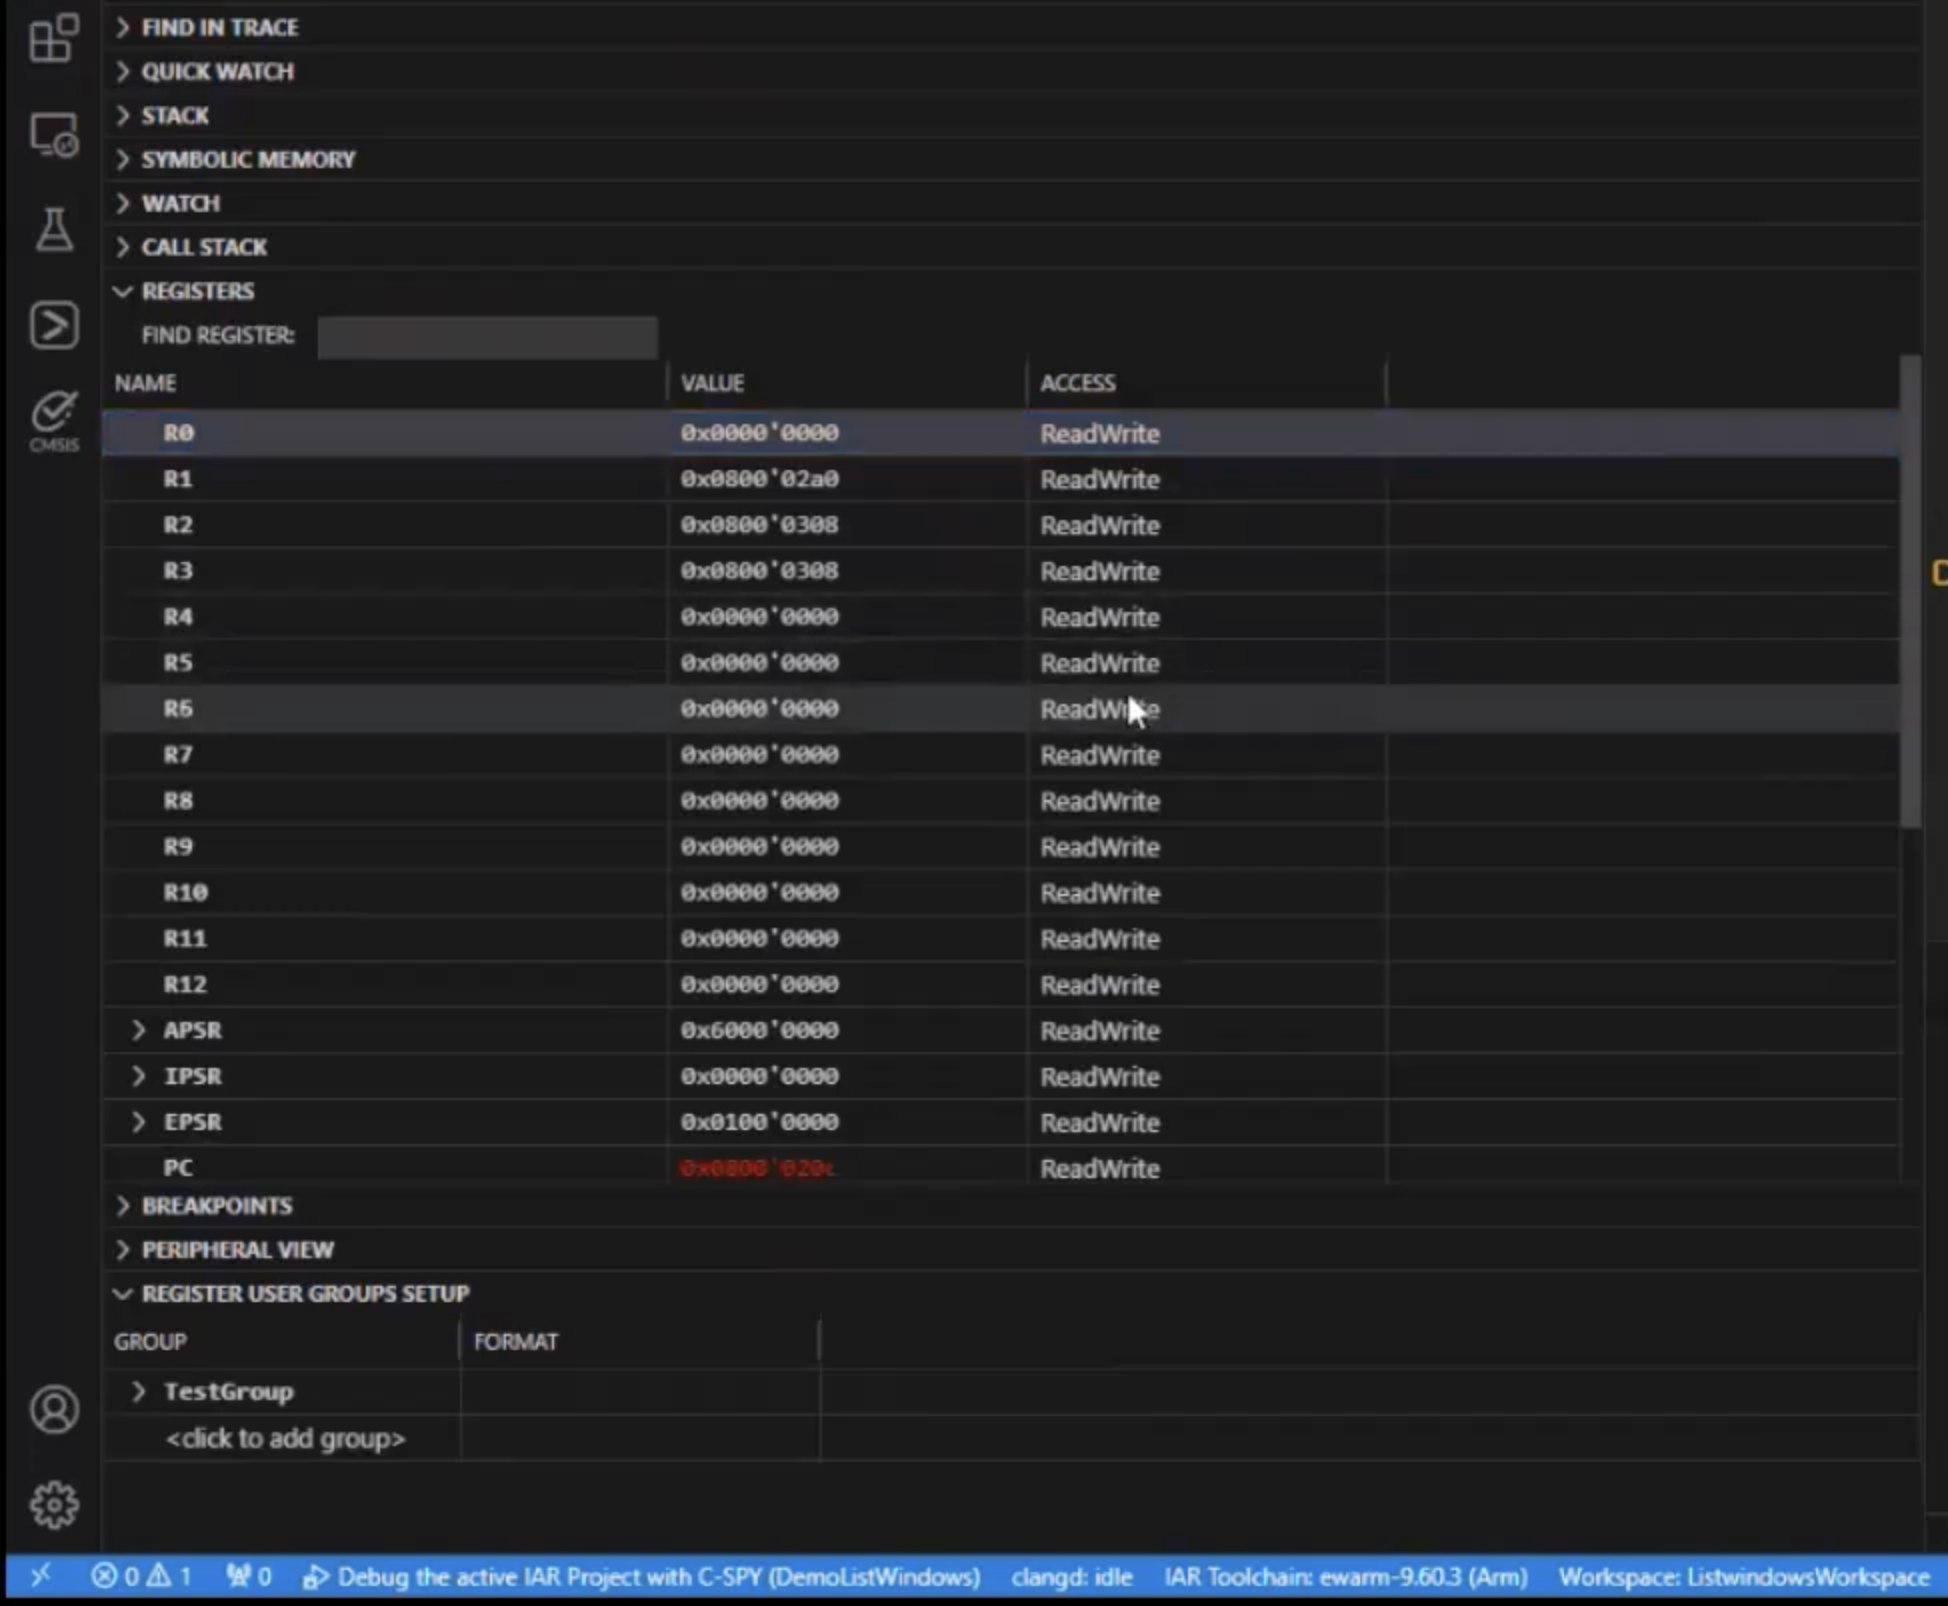
The Register View
Need to confirm whether a flag toggles during an interrupt storm?
Now you can watch it happen.
The ability to correlate these transitions directly with code lines shortens debug time dramatically, especially for timing-critical systems.
2. Symbolic Memory — From Raw Hex to Meaning
For decades, developers have stared at walls of hexadecimal values, trying to decode which variable lives at which address.
The Symbolic Memory View ends that ritual.
It replaces bare addresses with human-readable names and structures like global variables, stack data, peripheral buffers, all clearly labeled.
No more manual lookups or mental arithmetic.

The Symbolic Memory View
When you can instantly tell what a value represents, debugging stops being interpretation and becomes understanding.
3. Live Watch — Observation Without Interruption
Traditional watch windows force you to halt execution to see what’s happening.
But some bugs only appear when the system keeps running.
The Live Watch View streams variable changes continuously, letting you observe real-time behavior without stopping the target.
It’s perfect for closed-loop controls, sensor monitoring, or communication routines where timing matters more than state.

The PC register gets updated automatically when we step the program
You can literally watch your variables breathe and spot patterns that halting would destroy.
4. ETM / SWO Trace — Reconstructing Execution Flow
Trace data has always been powerful but cumbersome.
Parsing external logs or switching to specialized tools broke concentration.
The ETM/SWO Trace View integrates full trace capture inside VS Code.
You can step backward in time, follow function calls, and see exactly how execution unfolded without leaving your workspace.
That means when a crash occurs, you don’t guess where it started, because you see it.
5. Code Coverage — Validation Made Visible
In safety-critical projects, coverage isn’t optional. It’s proof.
The Code Coverage View tracks which lines and branches have executed in real time, helping teams verify that all conditions have been tested.

The Code Coverage view showing percentage of coverage for each function
You no longer need separate post-analysis tools because coverage becomes part of everyday debugging.
Just be warned, 100% coverage is NOT proof of no bugs! It just means you’re hitting all the lines and branches.
Built for How Engineers Already Work
The best tools don’t force engineers to change how they work, they enhance the way the engineers already do it.
That’s the design principle behind the IAR C-SPY Debugger for VS Code. It doesn’t ask you to adopt a new workflow. It simply brings professional-grade debugging into the workspace you already know.
With IAR Tools Extension Pack, you can write, build, and debug firmware directly inside VS Code.
Breakpoints, watch variables, peripheral registers, and trace views behave exactly as you expect. Not only that, they’re backed by IAR’s decades-proven compiler and analysis technology.
This integration also scales to the diverse hardware ecosystem that embedded engineers deal with daily.
Whether your project runs on an Arm Cortex-M, RISC-V, Microchip AVR, Renesas RL78/RX/RH850, or even Texas Instruments MSP430, the VS Code extensions work seamlessly across them.
Both the IAR Build and IAR C-SPY Debug extensions are compatible with the latest versions of IAR Embedded Workbench and IAR Build Tools, meaning you can move from one architecture to another without re-learning your setup.

It supports multiple microcontroller architectures
You can even configure multiple targets using standard VS Code launch profiles. Switching from an STM32 prototype in the morning to a Renesas RX board in the afternoon, all within the same environment.
For teams, that consistency is a quiet productivity multiplier.
Everyone sees the same data, uses the same interface, and can reproduce the same results.
Debug logs, traces, and coverage reports align perfectly across platforms.
From an engineer’s perspective, it feels natural:
write → build → trace → optimize all in one place, without context switches or mental overhead.
No IDE juggling. No friction. Just the familiar editor you already love, now equipped for real hardware.
See it in Action
Some ideas are best seen, not explained.
Watching Listwindows in motion immediately reveals how much time it saves and how naturally it fits into the VS Code workflow.
In the official IAR demo, you can see every part of the debugging experience come together:
live register updates, symbolic memory views, continuous variable streaming, ETM/SWO trace, functional profiling, and real-time code coverage, all running side by side inside Visual Studio Code.
It’s a clear demonstration of what “unified debugging” really looks like.
No switching windows. No fragmented insight. Just a smooth, synchronized view of your system’s inner workings.
👉 Watch the demo here and see how Listwindows transforms debugging from a slow, manual process into a fast, intuitive, and visual experience.
Struggling to keep your development skills up to date or facing outdated processes that slow down your team, raise costs, and impact product quality?
Here are 4 ways I can help you:
- Embedded Software Academy: Enhance your skills, streamline your processes, and elevate your architecture. Join my academy for on-demand, hands-on workshops and cutting-edge development resources designed to transform your career and keep you ahead of the curve.
- Consulting Services: Get personalized, expert guidance to streamline your development processes, boost efficiency, and achieve your project goals faster. Partner with us to unlock your team's full potential and drive innovation, ensuring your projects success.
- Team Training and Development: Empower your team with the latest best practices in embedded software. Our expert-led training sessions will equip your team with the skills and knowledge to excel, innovate, and drive your projects to success.
- Customized Design Solutions: Get design and development assistance to enhance efficiency, ensure robust testing, and streamline your development pipeline, driving your projects success.
Take action today to upgrade your skills, optimize your team, and achieve success.